
Concept explainers
Videos
Recall that in exercise 50 the personnel director for Electronics Associates developed the following estimated regression equation relating an employee’s score on a job satisfaction test to length of service and wage rate.
Where
x1 = length of service (years)
x2 = wage rate (dollars)
y = job satisfaction test score (higher scores indicate greater job satisfaction)
A portion of the Minitab computer output follows.
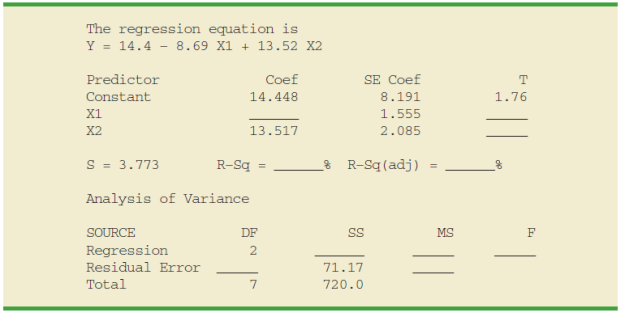
- a. Complete the missing entries in this output.
- b. Compute F and test using α = .05 to see whether a significant relationship is present.
- c. Did the estimated regression equation provide a good fit to the data? Explain.
- d. Use the t test and α = .05 to test H0: β1 = 0 and H0: β2 = 0.

Trending nowThis is a popular solution!

Chapter 15 Solutions
Statistics for Business & Economics, Revised (MindTap Course List)


- If your graphing calculator is capable of computing a least-squares sinusoidal regression model, use it to find a second model for the data. Graph this new equation along with your first model. How do they compare?arrow_forwardTable 2 shows a recent graduate’s credit card balance each month after graduation. a. Use exponential regression to fit a model to these data. b. If spending continues at this rate, what will the graduate’s credit card debt be one year after graduating?arrow_forwardAt a .01 level of significance is there sufficient evidence to conclude that the number of books sold is related to the number of registered students in a straight-line manner, and give the regression equation.arrow_forward
- Develop an estimated multiple regression equation that relates risk of a stroke to a person's age, systolic blood pressure and whether the person is a smoker. x1=persons age x2systrolic blood pressure x3=whether person is a smoker or non smokerarrow_forwardA car dealer wants to estimate the price of a used car based on the age of the car and the mileage. Based on a sample of 20 cars, she determines the sample regression equation that predicts price taxes on the basis of the age (in years) of the number of miles is Price=21,510-1230Age-0.035 Miles (a) If the age of the car was fixed and the mileage was increased by 10,000, would the price increase or decrease and by how much? (b) Predict the selling price of a five-year-old car with 65,000 miles. (Round your answers to the nearest whole number.)arrow_forwardA researcher investigated the relationship between family income and savings. Using data from 15 families, the computed r between income and savings was found to be 0.76. The researcher wants to test if there is a significant relationship between the two variables at 5% level of significance and create a regression equation to predict the possible savings given the income of the family. Interpret the computed r value. Test if there is a significant relationship between the two variables at 5% level of significancearrow_forward
- ** had to resubmit this question because the first time the data was duplicated and reflected incorrectly. The table below gives the number of hours spent unsupervised each day as well as the overall grade averages for seven randomly selected middle school students. Using this data, consider the equation of the regression line, yˆ=b0+b1xy^=b0+b1x, for predicting the overall grade average for a middle school student based on the number of hours spent unsupervised each day. Keep in mind, the correlation coefficient may or may not be statistically significant for the data given. Remember, in practice, it would not be appropriate to use the regression line to make a prediction if the correlation coefficient is not statistically significant. Hours Unsupervised 1 2 3 4 5 5.5 6 Overall Grades 96 89 87 77 76 68 64 **Please circle the answer for each step so I don't get confused. Thanks in advance for helping me with the breakdown and notes** Step 1 of 6 : Find the…arrow_forwardAssume that you want to predict Company Performance based on the linear effects of Trust and Commitment that exist among a company’s employees c) If you want to test whether there is a linear effect of Commitment and a curvilinear effect of Trust on Company Performance—such that Company Performance increases up to a certain level of Trust, after which Company Performance diminishes with increasing Trust levels—how would your regression equation look like? Further, explain your answer in your own words. Provide at least two sentences of explanation, in addition to giving the regression equation.arrow_forwardAccording to World Health Organization (WHO), the recommended limit for a noise level inside a classroom is 35 dBA. However, nine out of ten schools fail to meet this recommendation. A researcher wishes to conduct a study relevant to the prior information, but as a gap, he decides to include the area (in square meters) of every classroom and how it could possibly affect the resulting noise level. He selects 17 classrooms at random, and the noise levels are recorded in the next slide. a. Find the regression equation and construct the scatter plot diagram. b. Predict the noise level if a classroom has an area of 85.97 m2 . c. Calculate the coefficient of determination and interpret the findings. d. Calculate the coefficient of alienation and interpret the findings. Use Excelarrow_forward
- For the 2011 season, suppose the average number of passing yards per attempt for a certain NFL team was 6.1. Use the estimated regression equation developed in part (c) to predict the percentage of games won by that NFL team. (Note: For the 2011 season, suppose this NFL team's record was 7 wins and 9 losses. Round your answer to the nearest integer.)arrow_forwardYou spilled water on your calculations from (a) and can't remember what your estimated regression parameters are. But you do have two possible estimated errors for each of your initial four observations:arrow_forwardWhat is measured by the standard error of estimaate for a regression equation?arrow_forward

 Trigonometry (MindTap Course List)TrigonometryISBN:9781305652224Author:Charles P. McKeague, Mark D. TurnerPublisher:Cengage Learning