
Concept explainers
Videos
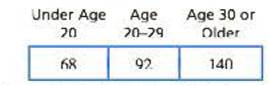
Automobile insurance is much more expensive for teenage drivers than for older drivers. To justify this cost difference, insurance companies claim that the younger drivers are much more likely to be involved in costly accidents. To test this claim, a researcher obtains information about registered drivers from the department of motor vehicles and selects a sample of n = 300 accident reports from the police department. The motor vehicle department reports the percentage of registered drivers in each age category’ as follows; 16% are younger than age 20; 28% are 20 to 29 years old; and 56% are age 30 or older. The number of accident reports for each age group is as follows:
- a. Do the data indicate that the distribution of accidents for the three age groups is significantly different from the distribution of drivers? Test with α = .05.
- b. Compute Cohen’s w to measure the size of the effect
- c. Write a sentence demonstrating how the outcome of the hypothesis test and the measure of effect size would appear in a research report.
Want to see the full answer?
Check out a sample textbook solution
Chapter 15 Solutions
Essentials of Statistics for The Behavioral Sciences (MindTap Course List)


 Holt Mcdougal Larson Pre-algebra: Student Edition...AlgebraISBN:9780547587776Author:HOLT MCDOUGALPublisher:HOLT MCDOUGAL
 Glencoe Algebra 1, Student Edition, 9780079039897...AlgebraISBN:9780079039897Author:CarterPublisher:McGraw Hill
 College Algebra (MindTap Course List)AlgebraISBN:9781305652231Author:R. David Gustafson, Jeff HughesPublisher:Cengage Learning