Principles of Economics 2e
2nd Edition
ISBN: 9781947172364
Author: Steven A. Greenlaw; David Shapiro
Publisher: OpenStax
expand_more
expand_more
format_list_bulleted
Textbook Question
Chapter 15, Problem 7SCQ
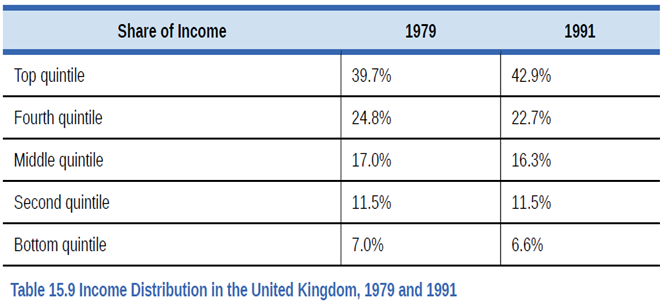
Table 15.9 shows the share of income going to each quintile of the income distribution for the United Kingdom in 1979 and 1991. Use this data to calculate what the points on a Lorenz curve would be, and sketch the Lorenz curve. How did inequality in the United Kingdom shift over this time period? How can you see the patterns in the quintiles in the Lorenz curves?
Expert Solution & Answer
Want to see the full answer?
Check out a sample textbook solutionStudents have asked these similar questions
1
The table below shows the share of income going to each quintile of the income distribution for a nation in
1950 and 2000. Use this data to calculate what the points on a Lorenz curve would be, and sketch
the Lorenz curve.
The purple line represents 1950.
The green line represents 2000.
Share of income received
1950
2000
Bottom 20%
10%
5%
Bottom 40%
30%
15%
Bottom 60%
50%
35%
Bottom 80%
75%
60%
All 100%
|100%
100%
Provide your answer below:
110
100
-90
-80
(90, f0)
(100, 70)
60
Perfect Equality
(100,50) Year 2000
50
(80,50 Year 1950/
40
(70, 30)
30
(50, 20)
20
(90, 20)
10
(60, 10)
60
80
Income Quintiles
20
40
100
-10
Cumulative Share of Income
The table below shows the share of income going to each quintile of the income distribution for a nation in 1955 and 2015. Use this data to calculate what the points on a Lorenz curve would be, and sketch the Lorenz curve.
The purple line represents 1955.
The green line represents 2015.
Chapter 15 Solutions
Principles of Economics 2e
Ch. 15 - Describe how each of these changes is likely to...Ch. 15 - Jonathan is a single father with one child. He can...Ch. 15 - Imagine that the government reworks the welfare...Ch. 15 - We have discovered that the welfare system...Ch. 15 - How does the TANF attempt to loosen the poverty...Ch. 15 - A group 0f 10 people have the following annual...Ch. 15 - Table 15.9 shows the share of income going to each...Ch. 15 - Using two demand and supply diagrams, one for the...Ch. 15 - Using two demand and supply diagrams, one for the...Ch. 15 - Here is one hypothesis: A well-funded social...
Ch. 15 - Here is a second hypothesis: A well-funded social...Ch. 15 - Which set of policies is more likely to cause a...Ch. 15 - Why is there reluctance on the part of some in the...Ch. 15 - How is the poverty rate calculated?Ch. 15 - What is the poverty line?Ch. 15 - What is the difference between poverty and income...Ch. 15 - How does the poverty trap discourage people from...Ch. 15 - How can the effect of the poverty trap be reduced?Ch. 15 - Who are the near-poor?Ch. 15 - What is the safety net?Ch. 15 - Briefly explain the differences between TANF, the...Ch. 15 - Who is included in the top income quintile?Ch. 15 - What is measured on the two axes of a Lorenz...Ch. 15 - If a country had perfect income equality what...Ch. 15 - How has the inequality of income changed in the...Ch. 15 - What are some reasons why a certain degree of...Ch. 15 - What are the main reasons economists give for the...Ch. 15 - Identify some public policies that can reduce the...Ch. 15 - Describe how a push for economic equality might...Ch. 15 - What goods and services would you include in an...Ch. 15 - If a family of three earned 20,000, would they be...Ch. 15 - Exercise 15.2 and Exercise 15.3 asked you to...Ch. 15 - Explain how you would create a government program...Ch. 15 - Many critics of government programs to help...Ch. 15 - Think about the business cycle: during a...Ch. 15 - Explain how a country may experience greater...Ch. 15 - The demand for skilled workers in the United...Ch. 15 - Explain a situation using the supply and demand...Ch. 15 - What do you think is more important to focus on...Ch. 15 - To reduce income inequality, should the marginal...Ch. 15 - Redistribution of income occurs through the...Ch. 15 - How does a society or a country make the decision...Ch. 15 - Explain what the long- and short-term consequences...Ch. 15 - In country A, the population is 300 million and 50...Ch. 15 - In country B, the population is 900 million and...Ch. 15 - Susan is a single mother with three children. She...Ch. 15 - A group of 10 people have the following annual...
Additional Business Textbook Solutions
Find more solutions based on key concepts
E5-20 Journalizing purchase transactions
Learning Objective 2 July 24 Kerch. Inv. $64 CR
(
Howie Jewelers had ...
Horngren's Accounting (12th Edition)
E2-13 Identifying increases and decreases in accounts and normal balances
Learning Objective 2
Insert the mis...
Horngren's Accounting (11th Edition)
Why are the social security and Medicare taxes paid by the employee not included in labor burden?
Construction Accounting And Financial Management (4th Edition)
What is the relationship between management by exception and variance analysis?
Cost Accounting (15th Edition)
Define cost object and give three examples.
Horngren's Cost Accounting: A Managerial Emphasis (16th Edition)
Discussion Questions 1. What characteristics of the product or manufacturing process would lead a company to us...
Managerial Accounting (5th Edition)
Knowledge Booster
Similar questions
- What is measured on the two axes of a Lorenz curve?arrow_forwardThe table shows after-tax income shares in Canada in 1986 and 2015. After-tax income After-tax income 1986 2015 (percent of total) Households Lowest 20 percent Second 20 percent Middle 20 percent Fourth 20 percent Highest 20 percent 5 11 18 25 41 7 13 18 23 39 Draw a point to show the income earned by the lowest 20 percent of households in 1986. Draw a point to show the income earned by the lowest 60 percent of households in 1986. Draw a Lorenz curve that is consistent with the two points you've plotted. Canadian after-tax income is distributed equally in 2015 than in 1986. 100- 90- 80- 70- 60+ 50- 40- 30+ 20- 10- 04 Cumulative percentage of income 10 20 30 40 50 60 70 80 90 100 Cumulative percentage of households >>> Draw only the objects specified in the question.arrow_forwardThere are three agents, a, b, and c. Person a receives $500 in income, b receives $400, and e gets $100. How much income of the total income does the poorest 1/3 receive? How much does the bottom 2/3 receive? Graph the Lorenz Curve. Calculate area B. Caleulate area A. What is the gini coefficient? Use a graph like the one below to draw a picture of the Lorenz curve and help in calculating areas A and B. %income 100% = 1- %population 100% - 1arrow_forward
- 10) What does a Lorenz curve show? Show a Lorenz curve for a country like the USA where there is a difference between income of the population.arrow_forwardBelow is a Lorenz Curve for a given country. Suppose its government establishes a 10% income tax on persons earning more than $500,000/year and uses the proceeds to subsidize secondary education. Show how the tax would affect income inequality by drawing the new Lorenz Curve.arrow_forwardBelow is a Lorenz Curve for a given country. Suppose its government cuts spending on Medicaid, Supplemental Nutrition Assistance Program and other aids to the poor. Show how the spending cuts would affect income inequality by drawing the new Lorenz Curve.arrow_forward
- = The $1.4 billion trick to make us accept income inequality Lotteries take money from the poor and redistribute it unequally. The poor, the uneducated, and minorities play the lottery the most, and it takes a big chunk of their income. Source: The Huffington Post, January 12, 2016 If the news clip is correct, how does a lottery change the distribution of income? Draw two Lorenz curves to illustrate your answer. CID Lotteries result in the distribution of income OA. becoming more unequal OB. becoming more equal OC. remaining unchanged Draw the Lorenz curve in a country that does not have lotteries. Label it Before. Draw the Lorenz curve for the country after the introduction of lotteries. Label it After. >>> To reposition the label click on the cross by the label box and drag it. Cumulative percentage of income 100- 80- 60- 0 20 40 60 80 100 Cumulative percentage of households >>> Draw only the objects specified in the question. 40- 20-arrow_forwardUsing the above Lorenz Curve, answer the following questions. . . Approximately what percentage of the income does the richest 20% of Country B earn? Approximately what percentage of the income does the poorest 20% of Country A earn? If the government of Country B increased the progressivity of income taxes, would its Lorenz Curve move closer to the 45-degree reference line, closer to Country A's Lorenz Curve, or not move at all?arrow_forwardIf a country had perfect income equality what would the Lorenz curve look like?arrow_forward
- The $1.4 billion trick to make us accept income inequality Lotteries take money from the poor and redistribute it unequally. The poor, the uneducated, and minorities play the lottery the most, and it takes a big chunk of their income Source: The Huffington Post, January 12, 2016 If the news clip is correct, how does a lottery change the distribution of income? Draw two Lorenz curves to illustrate your answer. Lotteries result in the distribution of income Draw the Lorenz curve in a country that does not have lotteries. Label it Before Draw the Lorenz curve for the country after the introduction of lotteries. Label it After >>> To reposition the label click on the cross by the label box and dragging it 100 80 60 40- 20 Cumulative percentage of income 100 20 40 60 00 Cumulative percentage of households >>>Draw only the objects specified in the question Garrow_forwardUsing the Lorenz Curve, answer the following questions. . . Approximately what percentage of the income does the richest 20% of Country B earn? Approximately what percentage of the income does the poorest 20% of Country A earn? If the government of Country B decreased the progressivity of income taxes, would its Lorenz Curve move closer to the 45-degree reference line, closer to Country A's Lorenz Curve, or not move at all?arrow_forward1. Below is a hypothetical breakdown of the income distribution in a country. Use those calculate what should be graphed on the Lorenz curve and then sketch a Lorenz curve for those given numbers. Using that Lorenz curve show how a Gini coefficient would be calculated and explain what the values of the Gini coefficient mean. (you do not have to calculate the Gini, just describe how you could do so)? Quintile Bottom 20% Lower Middle 20% Middle 20% Upper Middle 20% Top 20% Percent of GDP Received 16 20 $2arrow_forward
arrow_back_ios
SEE MORE QUESTIONS
arrow_forward_ios
Recommended textbooks for you
- Principles of Economics 2eEconomicsISBN:9781947172364Author:Steven A. Greenlaw; David ShapiroPublisher:OpenStaxExploring EconomicsEconomicsISBN:9781544336329Author:Robert L. SextonPublisher:SAGE Publications, Inc
- Microeconomics: Private and Public Choice (MindTa...EconomicsISBN:9781305506893Author:James D. Gwartney, Richard L. Stroup, Russell S. Sobel, David A. MacphersonPublisher:Cengage LearningEconomics: Private and Public Choice (MindTap Cou...EconomicsISBN:9781305506725Author:James D. Gwartney, Richard L. Stroup, Russell S. Sobel, David A. MacphersonPublisher:Cengage Learning
Principles of Economics 2e
Economics
ISBN:9781947172364
Author:Steven A. Greenlaw; David Shapiro
Publisher:OpenStax
Exploring Economics
Economics
ISBN:9781544336329
Author:Robert L. Sexton
Publisher:SAGE Publications, Inc
Microeconomics: Private and Public Choice (MindTa...
Economics
ISBN:9781305506893
Author:James D. Gwartney, Richard L. Stroup, Russell S. Sobel, David A. Macpherson
Publisher:Cengage Learning
Economics: Private and Public Choice (MindTap Cou...
Economics
ISBN:9781305506725
Author:James D. Gwartney, Richard L. Stroup, Russell S. Sobel, David A. Macpherson
Publisher:Cengage Learning