
Essentials of Statistics for The Behavioral Sciences (MindTap Course List)
9th Edition
ISBN: 9781337098120
Author: Frederick J Gravetter, Larry B. Wallnau, Lori-Ann B. Forzano
Publisher: Cengage Learning
expand_more
expand_more
format_list_bulleted
Concept explainers
Videos
Textbook Question
Chapter 15, Problem 8P
A communications company has developed three new designs for a cell phone. To evaluate consumer response, a sample of 120 college students is selected and each student is given all three phones to use for one week. At the end of the week, the students must identify which of the three designs they prefer. The distribution of preference is as follows:
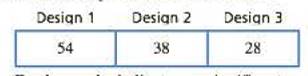
- a. Do the results indicate any significant preferences among the three designs?
- b. Compute Cohen’s w to measure the size of the effect.
Expert Solution & Answer

Trending nowThis is a popular solution!

Students have asked these similar questions
A communications company has developed three new designs for a cell phone. To evaluate consumer response, a sample of 120 college students is selected and each student is given all three phones to use for one week. At the end of the week, the students must identify which of the three designs they prefer. The distribution of preference is as follows:
Do the results indicate any significant preferences among the three designs?
Compute Cohen’s w to measure the size of the effect.
From the previous market survey on five different types of soft dringk A, B , C, D and E conducted in 2010, it is evident that 17% customers prefer A, 10% prefer B, 20% prefer C, 25% prefer D and rest of them prefer E. The company is intended to examine whether the current distribution of preference for these products differ from the 2010 preference. In a recent market survey on 200 custmers, each was asked which one he/she prefer. The results were as follows: 40 prefer drink A; 47 prefer B; 38 drink C; 35 prefer D, and 40 prefer E. Test whether the current distribution of preference differ from the existing distribution of preference. Use 5% level of significance for your conclusion. Show the p-value in graph.
Quinn, a market analyst at Chips 4U vending machine company, wants to determine the best allocation of snacks throughout schools in a school district where the company recently won a contract to install snack machines. In particular, Quinn wants to determine whether there is a relationship between grade level and snack preference. A random sample of 130 students is surveyed, and their school level and preferred snack are given in the table.
SNACK
granola bar
peanuts
pretzels
chocolate bar
TOTAL
ELEMENTARY
32
10
17
20
79
Expected:
HIGH SCHOOL
15
7
20
9
51
Expected:
TOTAL
47
17
37
29
130
Complete the contingency table by entering the expected values (round to 2 decimal places). Then conduct an appropriate hypothesis test at alpha=0.02 .
Determine the null and alternative hypotheses.
�0: Grade level and student snack preferences both follow a uniform distribution.��: Grade level and student snack preferences follow some other distribution.…
Chapter 15 Solutions
Essentials of Statistics for The Behavioral Sciences (MindTap Course List)
Ch. 15.1 - Which of the following is a characteristic of...Ch. 15.1 - Which of the following accurately describes the...Ch. 15.1 - A researcher uses a sample of n = 60 participants...Ch. 15.2 - Prob. 1LCCh. 15.2 - Prob. 2LCCh. 15.2 - A researcher uses a sample of 20 college...Ch. 15.3 - If a chi-square test for independence has df 3,...Ch. 15.3 - Prob. 2LCCh. 15.3 - Prob. 3LCCh. 15.4 - Prob. 1LC
Ch. 15.4 - A researcher obtains X2 = 4.0 for a test for...Ch. 15.4 - Under what circumstances should the chi-square...Ch. 15.5 - Prob. 1LCCh. 15.5 - Prob. 2LCCh. 15 - Prob. 1PCh. 15 - The student population at the state college...Ch. 15 - A developmental psychologist would like to deter...Ch. 15 - Data from the Department of Motor Vehicles...Ch. 15 - A psychologist examining art appreciation selected...Ch. 15 - A professor in the psychology department would...Ch. 15 - Automobile insurance is much more expensive for...Ch. 15 - A communications company has developed three new...Ch. 15 - Prob. 9PCh. 15 - Earlier in the chapter, we introduced the...Ch. 15 - Liu el al. (2015) recently reported the results of...Ch. 15 - Many businesses use some type of customer loyalty...Ch. 15 - In a classic study, Loftus and Palmer (1974)...Ch. 15 - In a study investigating freshman weight pain, the...Ch. 15 - Research results suggest that IQ scores for boys...Ch. 15 - Gender differences in dream content are well...Ch. 15 - Many parents allow their underage children to...Ch. 15 - A recent study indicates that people tend to...Ch. 15 - Research indicates that people who volunteer to...Ch. 15 - Research has demonstrated strong gender...
Knowledge Booster


Learn more about
Need a deep-dive on the concept behind this application? Look no further. Learn more about this topic, statistics and related others by exploring similar questions and additional content below.Similar questions
- A researcher has developed three different designs for a computer keyboard. A sample of n=60 participants is obtained, and each individual tests all three keyboards and identifies his or her favorite. The frequency distribution of the preferences is as follows: n=60 Design A Design B Design C 23 12 25 What is the df value for the chi-square statistic?arrow_forwardA researcher obtained a random sample of n = 60 students to determine whether there were any significant preferences among three leading brands of colas. Each student tasted all three brands and then selected his or her favorite. The resulting frequency distribution is as follows: Brand A Brand B Brand C 24 17 19 Are the data sufficient to indicate any preferences among the three brands? Test with α = .05.arrow_forwardThe owner of an ice cream shop claims that 40% of his customers prefer chocolate ice cream, 35% prefer vanilla ice cream, 15% prefer strawberry ice cream, and 10% prefer mint ice cream. One of his employees wishes to test this claim. The employee randomly selects 100 customers and asks them about their preferred ice cream flavor. The following table shows the preference of each of the 100 surveyed respondents. Chocolate vanilla strawberry mint 34 31 25 10 Assuming the requirements for the procedure have been met, which of the following procedures should the employee use to test the owner's claim about his customers' ice cream preferences? - chi-square test for homogeneity -chi-square goodness-of-fit test -chi-square test for independence -one-sample ?‑test for a mean -one-sample ?‑test for a proportionarrow_forward
- a marketing company is studying consumer preferences for four brands of softdrinks (A,B,C,D) and uses a random smaple of 400 customers. Using the observed requency data below, test the hypothesis of equal preferences for the four brands at the 0.05 level. Make sure to show your work. Brand Observed Frequency A 105 B 100 C 103 D 92arrow_forwardA random sample of statistics professors was asked to complete a survey including questions on curriculum content, computer integration, and software preferences. Of the 250 responses, 100 professors indicated that they preferred software package M and 80 preferred software package E, whereas the remainder were evenly split between preference for software package S and software package P. Do the data indicate that professors have a preference for any of these software packages?arrow_forwardA researcher has developed three different designs for a computer keyboard. A sample of n=60 participants is obtained, and each individual tests all three keyboards and identifies his or her favorite. The frequency distribution of the preferences is as follows: n=60 Design A Design B Design C 23 12 25 Assuming that the null hypothesis states that there are no preferences among thethree designs, find the expected frequencies for the chi-square test.arrow_forward
- M&M/MARS, makers of M&M chocolate candies, conducted a national poll in which more than 10 million people indicated their preferences for a new color. The tally of this poll resulted in the replacement of tan-colored M&Ms with new blue color. In the brochure "Colors," made available by M&M/MARS Consumer Affairs, the distribution of colors for the plain candies is as follows: Brown Yellow Red Orange Green Blue 30% 20% 20% 10% 10% 10% In a follow-up study, samples of 1-pound bags were used to determine whether the reported by the percentages were indeed valid. The following results were obtained for one sample of 506 plain candies. Brown Yellow Red Orange Green Blue 177 135…arrow_forwardA manufacturing company with 350 employees is changing the employee health insurance plan to either plan A or plan B. The company wants to know if employees have a preference between the two plans and whether or not preference differs between those employees who have family members covered under the current plan (group 1) and those who do not (group 2). The human resources office takes a simple random sample from each of the two groups, sends information about both plans to the employees in each sample, and asks them whether they prefer plan A or plan B. The table summarizes the responses received, with expected cell counts in parentheses. Plan A Plan B Total Yes (group 1) 40 (32.5) 20 (27.5) 60 No (group 2) 6 (13.5) 19 (11.5) 25 Total 46 39 85 Which statement is true about whether the conditions for the chi-square test for homogeneity have been met? A simple random sample should have been taken from all the employees, and then each employee in the…arrow_forwardA manufacturing company with 350 employees is changing the employee health insurance plan to either plan A or plan B. The company wants to know if employees have a preference between the two plans and whether or not preference differs between those employees who have family members covered under the current plan (group 1) and those who do not (group 2). The human resources office takes a simple random sample from each of the two groups, sends information about both plans to the employees in each sample, and asks them whether they prefer plan A or plan B. The table summarizes the responses received, with expected cell counts in parentheses. Plan A Plan B Total Yes (group 1) 40 (32.5) 20 (27.5) 60 No (group 2) 6 (13.5) 19 (11.5) 25 Total 46 39 85 Which statement is true about whether the conditions for the chi-square test for homogeneity have been met? A simple random sample should have been taken from all the employees, and then each employee in the…arrow_forward
arrow_back_ios
arrow_forward_ios
Recommended textbooks for you
 Holt Mcdougal Larson Pre-algebra: Student Edition...AlgebraISBN:9780547587776Author:HOLT MCDOUGALPublisher:HOLT MCDOUGAL
Holt Mcdougal Larson Pre-algebra: Student Edition...
Algebra
ISBN:9780547587776
Author:HOLT MCDOUGAL
Publisher:HOLT MCDOUGAL
Probability & Statistics (28 of 62) Basic Definitions and Symbols Summarized; Author: Michel van Biezen;https://www.youtube.com/watch?v=21V9WBJLAL8;License: Standard YouTube License, CC-BY
Introduction to Probability, Basic Overview - Sample Space, & Tree Diagrams; Author: The Organic Chemistry Tutor;https://www.youtube.com/watch?v=SkidyDQuupA;License: Standard YouTube License, CC-BY