
Probability and Statistics for Engineering and the Sciences
9th Edition
ISBN: 9781305251809
Author: Jay L. Devore
Publisher: Cengage Learning
expand_more
expand_more
format_list_bulleted
Videos
Textbook Question
Chapter 15.1, Problem 3E
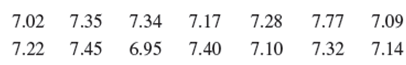
The accompanying data is a subset of the data reported in the article “Synovial Fluid pH, Lactate, Oxygen and Carbon Dioxide Partial Pressure in Various Joint Diseases” (Arthritis and Rheumatism, 1971: 476–477). The observations are pH values of synovial fluid (which lubricates joints and tendons) taken from the knees of individuals suffering from arthritis. Assuming that true average pH for nonarthritic individuals is 7.39, test at level .05 to see whether the data indicates a difference between average pH values for arthritic and nonarthritic individuals.
Expert Solution & Answer

Trending nowThis is a popular solution!

Students have asked these similar questions
Below are pupil sizes from two samples: 8 men and 8 women (measured in millimeters). Test the hypothesis that thee is a difference in pupil sizes between males and females, using an alpha level of .01.
Males
Females
7.7
8.9
7.5
8.7
6.9
9.0
7.8
8.8
7.7
7.9
6.9
8.8
4.5
9.0
7.5
9.0
What is the Critical Value?
What is the critical value?
Wj\hat is the p value?
The article “Monte Carlo Simulation—Tool for Better Understanding of LRFD” (J. of Structural Engr., 1993:1586–1599) suggests that yield strength (ksi) for A36 grade steel is normally distributed with a mean of 50.2 ksi and a standard deviation of 3.8 ksi.. What yield strength separates the strongest 5% from the others? (Use 2 decimal places) Show the area of interest in the density curve.
Chapter 15 Solutions
Probability and Statistics for Engineering and the Sciences
Ch. 15.1 - Give as much information as you can about the...Ch. 15.1 - Here again is the data on expense ratio (%) for a...Ch. 15.1 - The accompanying data is a subset of the data...Ch. 15.1 - A random sample of 15 automobile mechanics...Ch. 15.1 - Both a gravimetric and a spectrophotometric method...Ch. 15.1 - Reconsider the situation described in Exercise 39...Ch. 15.1 - Use the large-sample version of the Wilcoxon test...Ch. 15.1 - Reconsider the port alcohol content data from...Ch. 15.1 - Prob. 9ECh. 15.2 - Prob. 10E
Ch. 15.2 - Prob. 11ECh. 15.2 - The article A Study of Wood Stove Particulate...Ch. 15.2 - The urinary fluoride concentration (parts per...Ch. 15.2 - Prob. 14ECh. 15.2 - The article Measuring the Exposure of Infants to...Ch. 15.2 - Prob. 16ECh. 15.3 - Prob. 17ECh. 15.3 - Compute the 99% signed-rank interval for true...Ch. 15.3 - Prob. 19ECh. 15.3 - Prob. 20ECh. 15.3 - Prob. 21ECh. 15.3 - Compute a 99% CI for 1 2 using the data in...Ch. 15.4 - The accompanying data refers to concentration of...Ch. 15.4 - Prob. 24ECh. 15.4 - Prob. 25ECh. 15.4 - Prob. 26ECh. 15.4 - In an experiment to study the way in which...Ch. 15 - The article Effects of a Rice-Rich Versus...Ch. 15 - Prob. 29SECh. 15 - The given data on phosphorus concentration in...Ch. 15 - Prob. 31SECh. 15 - Prob. 32SECh. 15 - The sign test is a very simple procedure for...Ch. 15 - Prob. 34SECh. 15 - Prob. 35SECh. 15 - Prob. 36SE
Knowledge Booster


Learn more about
Need a deep-dive on the concept behind this application? Look no further. Learn more about this topic, statistics and related others by exploring similar questions and additional content below.Similar questions
- Find the average value of y = √ax over [0, a]arrow_forwardFind the average value over the given interval. y=7e^-x; [0,5]arrow_forwardThe article “Effect of Internal Gas Pressure on the Com- pression Strength of Beverage Cans and Plastic Bottles” (J. of Testing and Evaluation, 1993: 129–131) includes the accompanying data on compression strength (lb) for a sample of 12-oz aluminum cans filled with strawberry drink and another sample filled with cola. Does the data suggest that the extra carbonation of cola results in a higher average compression strength? Base your answer on a P-value. What assumptions are necessary for your analysis? ( use ? = 0.01 )arrow_forward
- The department of zoology at the Virginia Polytechnic Institute and State University carried out a study to determine if there is a significant difference in the density of organisms in two different stations located in Cedar Run, a secondary river that is located in the river basin. Roanoke. Drainage from a sewage treatment plant and overflow from the Federal Mogul Corporation sedimentation pond enter the flow near the source of the river. The following data give the density measurements, in numbers of organisms per square meter, at the two different collecting stations. Number of organisms per square meter Station 1 Station 2 5030 2800 13700 4670 10730 6890 11400 7720 860 7030 2200 7330 4250 2810 15040 1330 4980 3320 11910 1230 8130 2130 26850 2190 17660 22800 1130 1690 With a significance level of 0.05, can we conclude that the densities are the same in the two…arrow_forwardThe area under the normal standard curve to the left of z=0 is... a) 0.5 b)1 c)-0.5 d)-1arrow_forwardThe article “Wastewater Treatment Sludge as a Raw Material for the Production of Bacillus thuringiensis Based Biopesticides” (M. Tirado Montiel, R. Tyagi, and J. Valero, Water Research, 2001:3807–3816) presents measurements of total solids, in g/L, for seven sludge specimens. The results (rounded to the nearest gram) are 20, 5, 25, 43, 24, 21, and 32. Assume the distribution of total solids is approximately symmetric. a) Can you conclude that the mean concentration of total solids is greater than 14 g/L? Compute the appropriate test statistic and find the P-value. b) Can you conclude that the mean concentration of total solids is less than 30 g/L? Compute the appropriate test statistic and find the P-value. c) An environmental engineer claims that the mean concentration of total solids is equal to 18 g/L. Can you conclude that the claim is false?arrow_forward
- Consider the following 10 measurements about the cohesion of a soil: 12 kPa, 14 kPa, 15 kPa, 14.5 kPa, 16.0 kPa, 18 kPa, 15 kPa, 16.2 kPa, 17. 6 kPa, 13 kPa. Work out the solutions of the following two problems, assuming the cohesion follows the normal and lognormal distributions, respectively. (1) Draw the PDF of the cohesion; (2) Evaluate the probability that the cohesion based on the PDF is less than 5 kPa, 10 kPa, and 15 kPa; (3) Assess the effect of the type of distribution on the results.arrow_forwardThe percentage of all possible observations of the variable that lie between 7 and 12 equals the area under its density curve between and , expressed as a percentage.arrow_forwardfine the area under the normal standard curve that lies between z=1.26 and z=2.32arrow_forward
- Two quality control technicians measured the surface finish of a metal part, obtaining the data in the table below. Assume that the measurements are normally distributed.arrow_forwardlet X and Y are two random variables with p.d.f as f(x,y)=3x2y+3yx2 0<x<1 0<x<1.find conditional density of X given Y?.Find mean mode and standard deviation of r.v Y?. Correlation between X and Y?. check that X and Y are independent or not?.arrow_forwardSuppose that samples of polythene bags from two manufacturers A and B are tested by a prospective buyer for bursting pressure, with the following results: If the prices are the same, which manufacture’s bags would be preferred by the buyer? Why?arrow_forward
arrow_back_ios
SEE MORE QUESTIONS
arrow_forward_ios
Recommended textbooks for you
 MATLAB: An Introduction with ApplicationsStatisticsISBN:9781119256830Author:Amos GilatPublisher:John Wiley & Sons Inc
 Probability and Statistics for Engineering and th...StatisticsISBN:9781305251809Author:Jay L. DevorePublisher:Cengage Learning
 Statistics for The Behavioral Sciences (MindTap C...StatisticsISBN:9781305504912Author:Frederick J Gravetter, Larry B. WallnauPublisher:Cengage Learning
 Elementary Statistics: Picturing the World (7th E...StatisticsISBN:9780134683416Author:Ron Larson, Betsy FarberPublisher:PEARSON
 The Basic Practice of StatisticsStatisticsISBN:9781319042578Author:David S. Moore, William I. Notz, Michael A. FlignerPublisher:W. H. Freeman
 Introduction to the Practice of StatisticsStatisticsISBN:9781319013387Author:David S. Moore, George P. McCabe, Bruce A. CraigPublisher:W. H. Freeman
MATLAB: An Introduction with Applications
Statistics
ISBN:9781119256830
Author:Amos Gilat
Publisher:John Wiley & Sons Inc
Probability and Statistics for Engineering and th...
Statistics
ISBN:9781305251809
Author:Jay L. Devore
Publisher:Cengage Learning
Statistics for The Behavioral Sciences (MindTap C...
Statistics
ISBN:9781305504912
Author:Frederick J Gravetter, Larry B. Wallnau
Publisher:Cengage Learning
Elementary Statistics: Picturing the World (7th E...
Statistics
ISBN:9780134683416
Author:Ron Larson, Betsy Farber
Publisher:PEARSON
The Basic Practice of Statistics
Statistics
ISBN:9781319042578
Author:David S. Moore, William I. Notz, Michael A. Fligner
Publisher:W. H. Freeman
Introduction to the Practice of Statistics
Statistics
ISBN:9781319013387
Author:David S. Moore, George P. McCabe, Bruce A. Craig
Publisher:W. H. Freeman
Hypothesis Testing using Confidence Interval Approach; Author: BUM2413 Applied Statistics UMP;https://www.youtube.com/watch?v=Hq1l3e9pLyY;License: Standard YouTube License, CC-BY
Hypothesis Testing - Difference of Two Means - Student's -Distribution & Normal Distribution; Author: The Organic Chemistry Tutor;https://www.youtube.com/watch?v=UcZwyzwWU7o;License: Standard Youtube License