
Videos
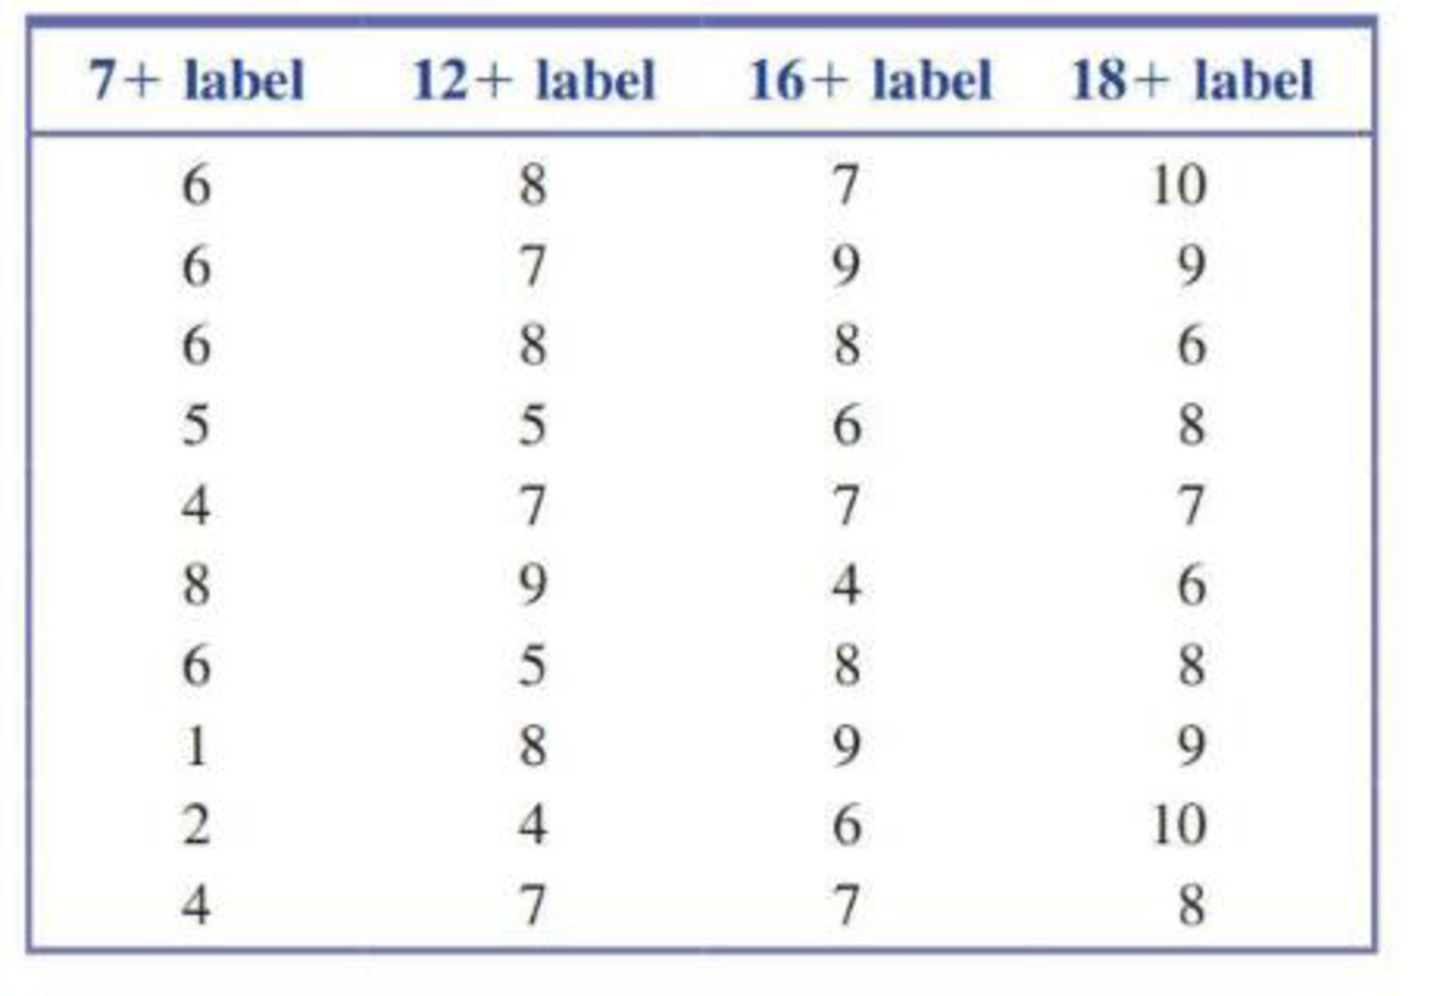
The paper referenced in the previous exercise also gave data for 12- to 13-year-old girls. Data consistent with summary values in the paper are shown below. Do the data provide convincing evidence that the mean rating associated with the game description for 12- to 13-year-old girls is not the same for all four age restrictive rating labels? Test the appropriate hypotheses using α = 0.05.
15.5 The authors of the paper “Age and Violent Content Labels Make Video Games Forbidden Fruits for Youth” (Pediatrics [2009]: 870–876) carried out an experiment to determine if restrictive labels on video games actually increased the attractiveness of the game for young game players. Participants read a description of a new video game and were asked how much they wanted to play the game. The description also included an age rating. Some participants read the description with an age restrictive label of 7 +, indicating that the game was not appropriate for children under the age of 7. Others read the same description, but with an age restrictive label of 12+, 16+, or 18 +.
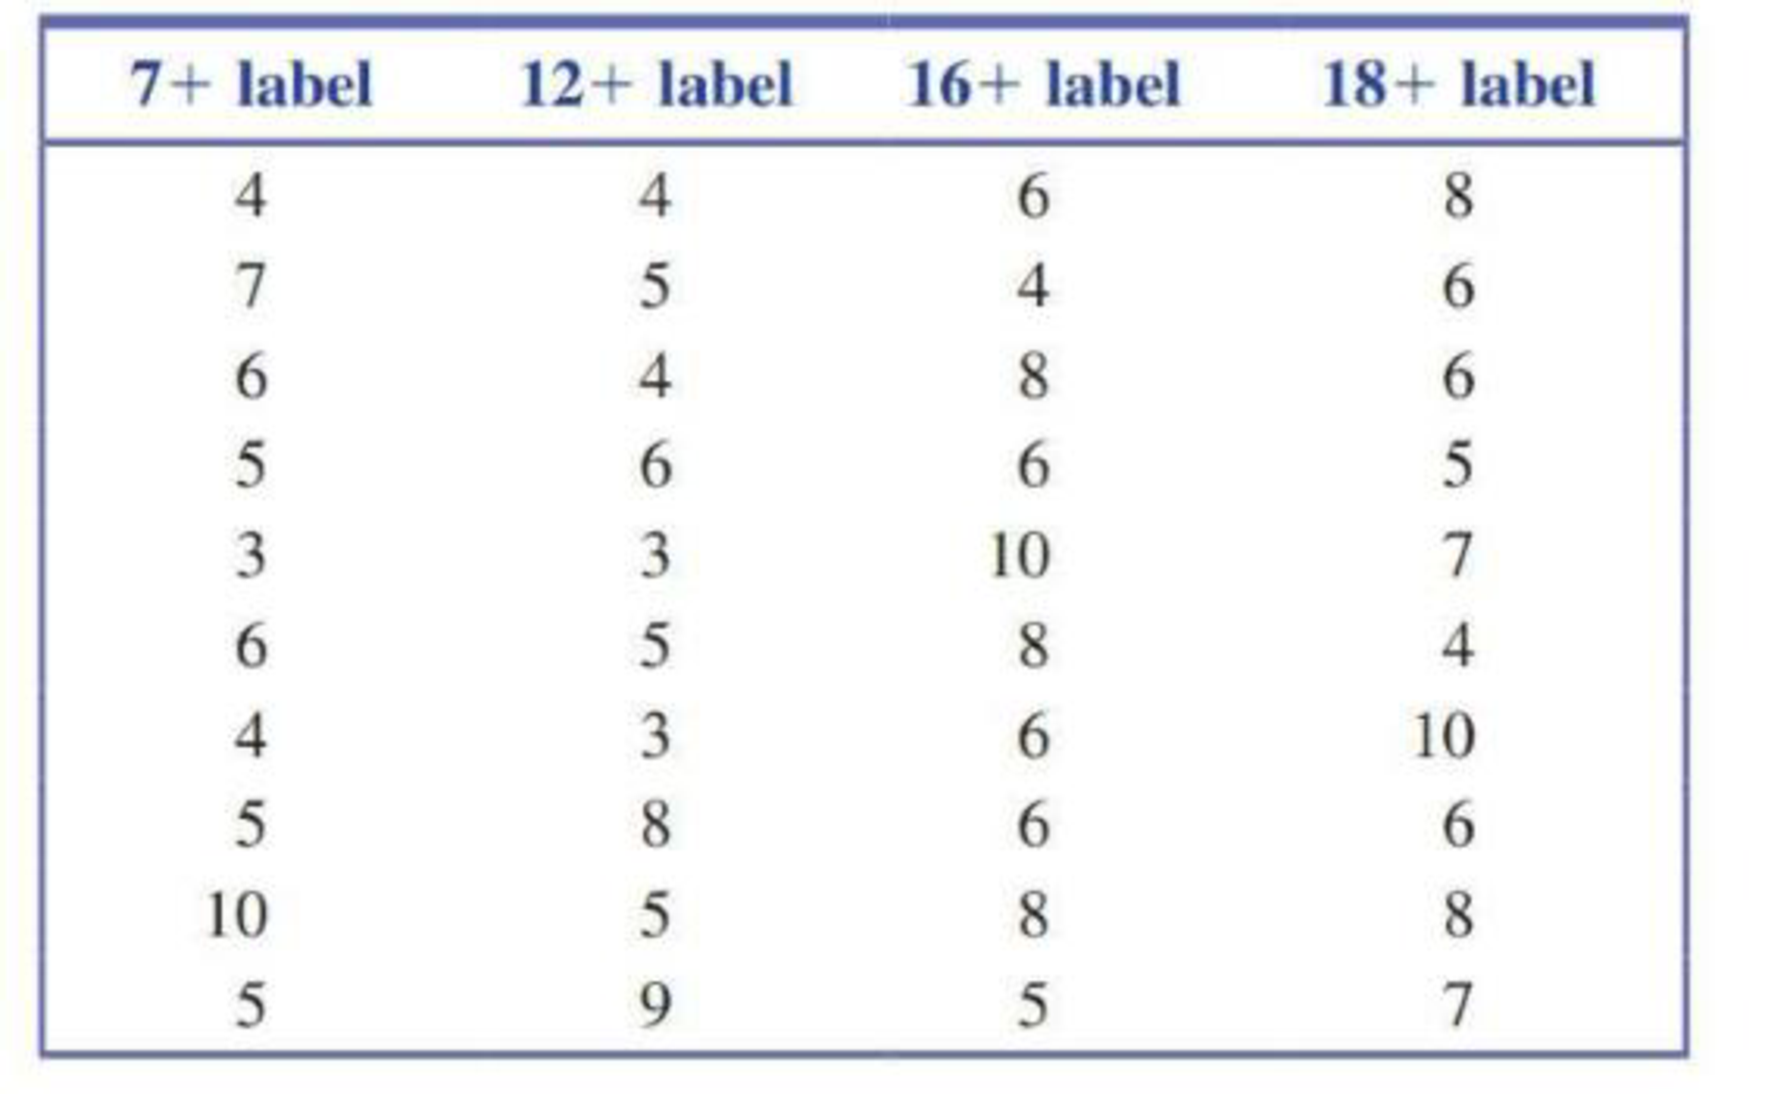
The data on the following page for 12- to 13-year-old boys are consistent with summary statistics given in the paper. (The sample sizes in the actual experiment were larger.) For purposes of this exercise, you can assume that the boys were assigned at random to one of the four age label treatments (7+, 12+, 16 +, and 18 +). Data shown are the boys’ ratings of how much they wanted to play the game on a scale of 1 to 10.
Do the data provide convincing evidence that the means of the ratings associated with the game descriptions by 12- to 13-year-old boys are not the same for all four restrictive rating labels? Test the appropriate hypotheses using a significance level of 0.05. (Hint: See Example 15.4.)
Want to see the full answer?
Check out a sample textbook solution
Chapter 15 Solutions
Introduction To Statistics And Data Analysis


- A scientist selected a random sample of seven varieties of peach ice cream to investigate the relationship between the density, in pounds per cubic inch, of the varieties of ice cream and the percent concentration of peaches in the ice cream. Assuming all conditions for inference are met, which of the following significance tests should be used to investigate whether there is convincing evidence at the 0.05 level of significance that a greater percent of peaches in the ice cream is associated with an increase in the density of the ice cream? A. A two-sample t-test for a difference between means B. A chi-square test of independence C. A linear regression t-test for slope D. A two-sample z-test for a difference between proportions E. A matched pairs t-test for a mean differencearrow_forwardIn a study with 11 participants, what would be your critical t score for a one-tailed test at the .05 α level?arrow_forwardDo adults (age 20–45) with children and adults without children have the same distribution of type of vehicle that is driven? In a large city, 130 randomly selected adults with children and 170 randomly selected adults without children were asked which type of car best describes the vehicle they primarily drive: car, truck, van, or SUV. A significance test will be conducted using the data to determine if there is convincing evidence at α = 0.05 that the distribution of type of vehicle driven differs between adults (age 20–45) with children and adults without children. What are the hypotheses for this test? H0: There is in the distribution of vehicle type driven between adults (aged 20–45) with children and adults without children. Ha: There is in the distribution of vehicle type driven between adults (aged 20–45) with children and adults without children.arrow_forward
- This chart shows the results of two random samples that measured the average number of minutes per charge for AA Lithium-ion (Li-ion) rechargeable batteries versus Nickel-Metal Hydride (NiMH) rechargeable batteries. Down below shows the hypothesis test using significance level (α) = 0.05 to determine if the true average number of minutes per charge for NiMH batteries is smaller than that for Li-ion batteries. 1. From the data given from the first graph below, what would be the correct p value? (the one tail or the two tail?) t-Test: Two-Sample Assuming Unequal Variances NiMH Li-ion Mean 89.35714 95 Variance 3.93956 59.75 Observations 14 17 Hypothesized Mean Difference 0 df 19 t Stat -2.89621 P(T<=t) one-tail 0.004628 t Critical one-tail 1.729133 P(T<=t) two-tail 0.009255 t Critical two-tail 2.093024 For the bottom graph: 1.. Find the point estimate (you can do this by subtracting Group 2…arrow_forwardIn order to investigate a claim that the average time required for the county fire department to respond to a reported fire is greater than 15 minutes, county staff determined the response times for 40 randomly selected fire reports. The data was used to test H0H0: μ = 15 versus HaHa: μ > 15 and the computed P‐value was 0.12. If a 0.05 level of significance is used, what conclusions can be drawn? There is convincing evidence that the mean response time is 15 minutes (or less). There is convincing evidence that the mean response time is greater than 15 minutes. There is not convincing evidence that the mean response time is greater than 15 minutes.arrow_forwardA cellphone provider has the business objective of wanting to determine the proportion of subscribers who would upgrade to a new cellphone with improved features if it were made available at a substantially reduced cost. Data are collected from a random sample of 500 subscribers. The results indicate that 135 of the subscribers would upgrade to a new cellphone at a reduced cost. At the 0.05 level of significance, is there evidence that more than 20% of the customers would upgrade to a new cellphone at a reduced cost? How would the manager in charge of promotional programs concerning residential customers use the results in (a)?arrow_forward
- A Canadian study measuring depression level in teens (as reported in the Journal of Adolescence, vol. 25, 2002) randomly sampled 112 male teens and 101 female teens, and scored them on a common depression scale (higher score representing more depression). The researchers suspected that the mean depression score for male teens is higher than for female teens, and wanted to check whether data would support this hypothesis. What conclusion can you draw from the output? The data provide sufficient evidence to reject H0 and to conclude that the mean depression score for male teens is larger than that of female teens. The data provide sufficient evidence to conclude that male and female teens do not differ in mean depression score. The data do not provide sufficient evidence to conclude that the mean depression score of male teens is larger than that of female teens. The data do not provide sufficient evidence to reject H0, so we accept it, and conclude that male and female teens do…arrow_forwardResearchers investigated whether a new process for producing yarn could reduce the mean amount of volatile organic compounds (VOCs) emitted by carpet. From random samples of carpets, the researchers found the mean reduction of VOCs emitted by carpets made with yarn produced by the new process compared with that of carpets made with yarn produced by the traditional process was 13 parts per million (ppm). All conditions for inference were met, and the p-value for the appropriate hypothesis test was 0.095. Which of the following statements is the best interpretation of the p-value? (A) The probability that the null hypothesis is true is 0.095. (B) The probability that the alternative hypothesis is true is 0.095. (C) The probability of observing a mean reduction of 13 ppm is 0.095.(D) If the null hypothesis is true, the probability of observing a mean reduction of at least 13 ppm is 0.095. (E) If the null hypothesis is true, the probability of observing a mean reduction of at most 13 ppm…arrow_forwardA well-known brokerage firm executive claimed that at least 90% of investors are currently confident of meeting their investment goals. An XYZ Investor Optimism Survey, conducted over a two week period, found that in a sample of 800 people, 88% of them said they are confident of meeting their goals. What practical conclusion can we make about the claim? What would be our formal conclusion if we used a 0.01 significance level?arrow_forward
- To test the fairness of law enforcement in its area, a local citizens group wanted to know whether women and men are unequally likely to get speeding tickets. 400 randomly selected adults were phoned and asked whether or not they had been cited for speeding in the last year. using the results in the following table and a 0.10 level of significance Men ticket =35, Men not ticketed= 144 women ticketed= 22, women not ticketed = 199 Compute the test statisticarrow_forwardIn a study of the accuracy of fast food drive-through orders, one restaurant had 31 orders that were not accurate among 399 orders observed. Use a 0.01 significance level to test the claim that the rate of inaccurate orders is equal to 10%. Does the accuracy rate appear to be acceptable? Identify the null and alternative hypotheses for this test. Choose the correct answer below. A. H0: p=0.1 H1: p>0.1 B. H0: p=0.1 H1: p<0.1 C. H0: p=0.1 H1: p≠0.1 D. H0: p≠0.1 H1:p= Identify the test statistic for this hypothesis test. The test statistic for this hypothesis test is _____ (Round to two decimal places as needed.) Identify the P-value for this hypothesis test. The P-value for this hypothesis test is ____ (Round to three decimal places as needed.) Identify the conclusion for this hypothesis test. A. Reject H0. There is sufficient evidence to warrant rejection of the claim that the rate of inaccurate orders is equal to 10%.…arrow_forwardIn a study, 28 adults with mild periodontal disease are assessed before and 6 months after implementation of a dental-education program intended to promote better oral hygiene. After 6 months, periodontal status improved in 15 patients, declined in 8, and remained the same in 5. 9.1 Assess the impact of the program statistically (use a two-sided test). Suppose patients are graded on the degree of change in periodontal status on a 7-point scale, with +3 indicating the greatest improvement, 0 indicating no change, and −3 indicating the greatest decline. The data are given in Table 9.9. 9.2 What nonparametric test can be used to determine whether a significant change in periodontal status has occurred over time? 9.3 Implement the procedure in Problem 9.2 and report a p-value.arrow_forward
 MATLAB: An Introduction with ApplicationsStatisticsISBN:9781119256830Author:Amos GilatPublisher:John Wiley & Sons Inc
 Probability and Statistics for Engineering and th...StatisticsISBN:9781305251809Author:Jay L. DevorePublisher:Cengage Learning
 Statistics for The Behavioral Sciences (MindTap C...StatisticsISBN:9781305504912Author:Frederick J Gravetter, Larry B. WallnauPublisher:Cengage Learning
 Elementary Statistics: Picturing the World (7th E...StatisticsISBN:9780134683416Author:Ron Larson, Betsy FarberPublisher:PEARSON
 The Basic Practice of StatisticsStatisticsISBN:9781319042578Author:David S. Moore, William I. Notz, Michael A. FlignerPublisher:W. H. Freeman
 Introduction to the Practice of StatisticsStatisticsISBN:9781319013387Author:David S. Moore, George P. McCabe, Bruce A. CraigPublisher:W. H. Freeman