
Videos
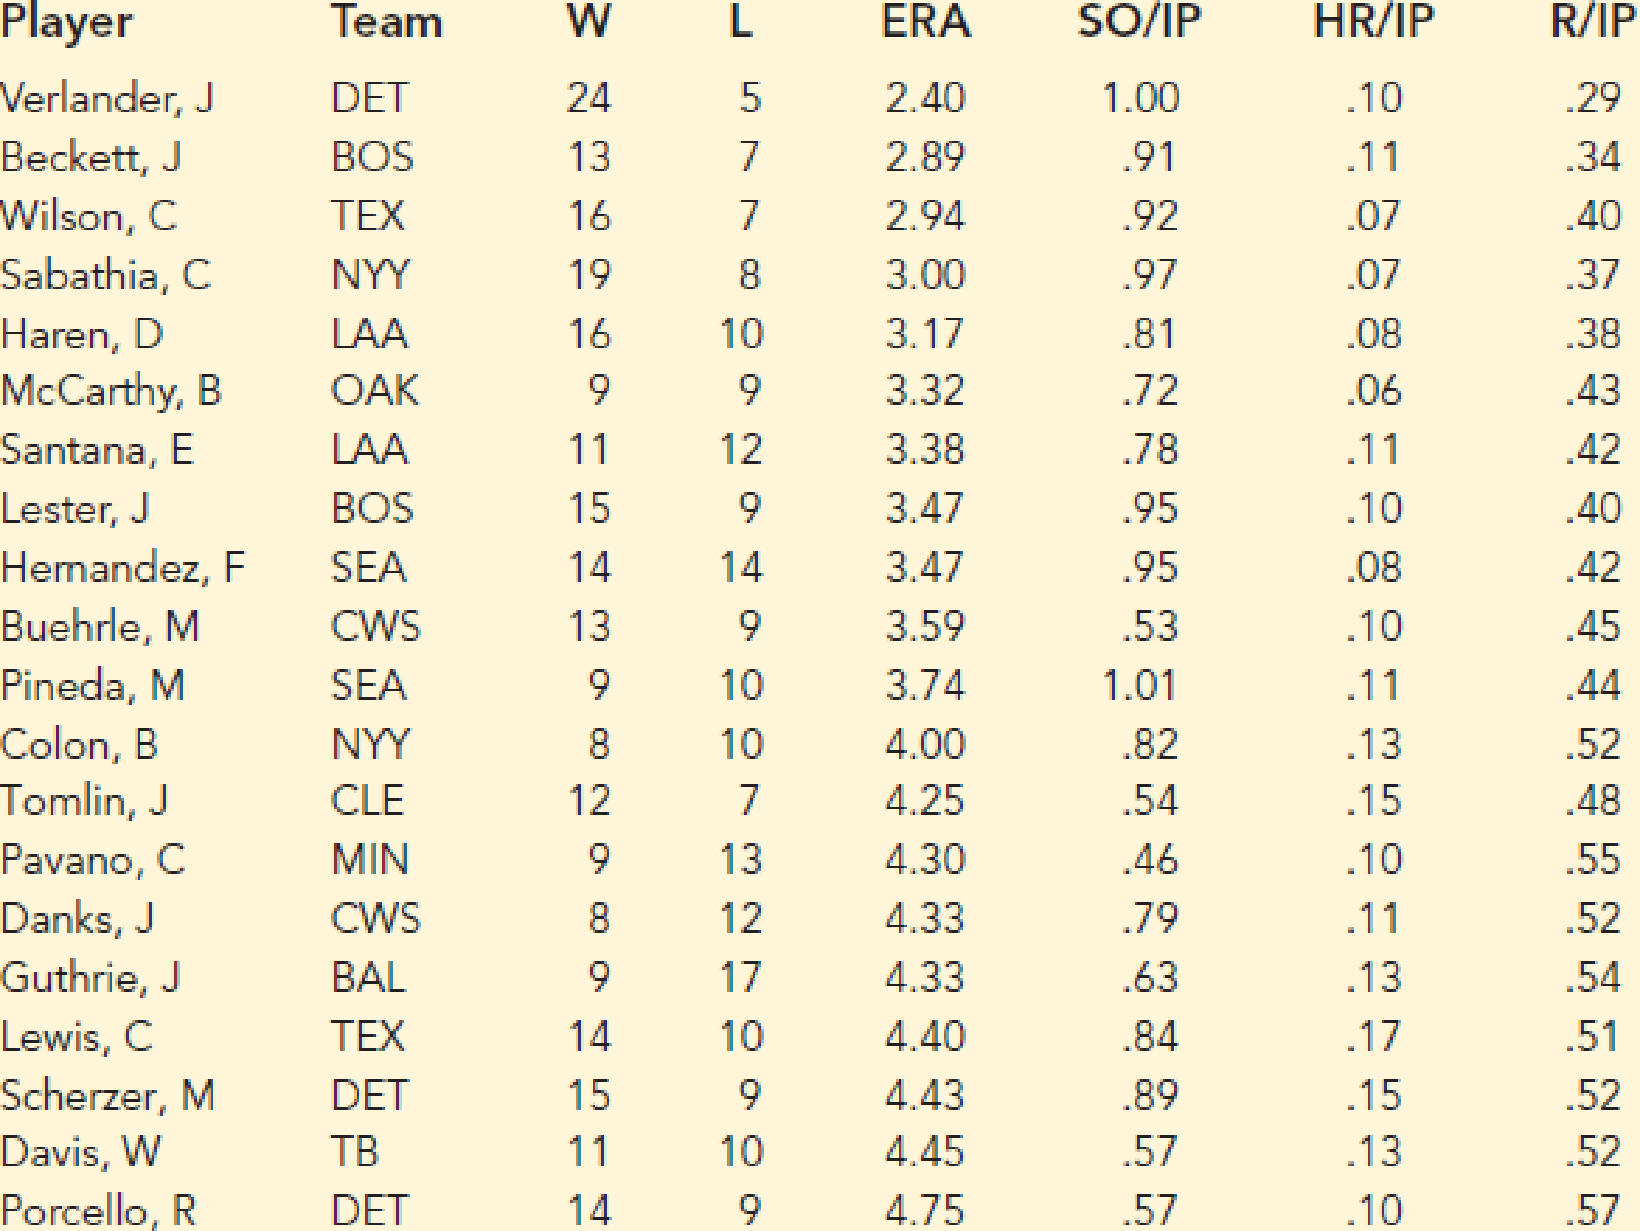
Baseball Pitcher Performance. Major League Baseball (MLB) consists of teams that play in the American League and the National League. MLB collects a wide variety of team and player statistics. Some of the statistics often used to evaluate pitching performance are as follows:
ERA: The average number of earned runs given up by the pitcher per nine innings. An earned run is any run that the opponent scores off a particular pitcher except for runs scored as a result of errors.
SO/IP: The average number of strikeouts per inning pitched.
HR/IP: The average number of home runs per inning pitched.
R/IP: The number of runs given up per inning pitched.
The following data show values for these statistics for a random sample of 20 pitchers from the American League for a full season.
- a. Develop an estimated regression equation that can be used to predict the average number of runs given up per inning given the average number of strikeouts per inning pitched.
- b. Develop an estimated regression equation that can be used to predict the average number of runs given up per inning given the average number of home runs per inning pitched.
- c. Develop an estimated regression equation that can be used to predict the average number of runs given up per inning given the average number of strikeouts per inning pitched and the average number of home runs per inning pitched.
- d. A. J. Burnett, a pitcher for the New York Yankees, had an average number of strikeouts per inning pitched of .91 and an average number of home runs per inning of .16. Use the estimated regression equation developed in part (c) to predict the average number of runs given up per inning for A. J. Burnett. (Note: The actual value for R/IP was .6.)
- e. Suppose a suggestion was made to also use the earned run average as another independent variable in part (c). What do you think of this suggestion?
a.
Find the estimated regression equation that could be used to predict the average number of runs given up per inning, when the average number of strikeouts per innings pitched is given.
Answer to Problem 10E
The estimated regression equation that could be used to predict the average number of runs given up per inning, when the average number of strikeouts per innings pitched is given is
Explanation of Solution
Calculation:
The Major League Baseball (MLB) dataset consist of statistics regarding the average number of earned runs given up by the pitcher per nine innings (ERA), the average number of strikeouts per innings pitched (SO/IP), the average number of home runs per innings pitched (HR/IP) and the number of runs given up per innings pitched (R/IP).
Multiple linear regression model:
A multiple linear regression model is given as
Regression:
Software procedure:
Step-by-step procedure to get the regression equation using EXCEL software:
- Open an EXCEL sheet and enter the data on W, L, ERA, SO/IP, HR/IP and R/IP corresponding to columns A, B, C, D, E and F, respectively.
- Select Data > Data Analysis > Regression.
- Click OK.
- Under Input Y Range enter $F$1:$F$21.
- Under Input X Range enter $D$1:$D$21.
- Click the box of Labels.
- Under Output Range enter $I$1.
- Click OK.
The output using EXCEL software is given as follows:
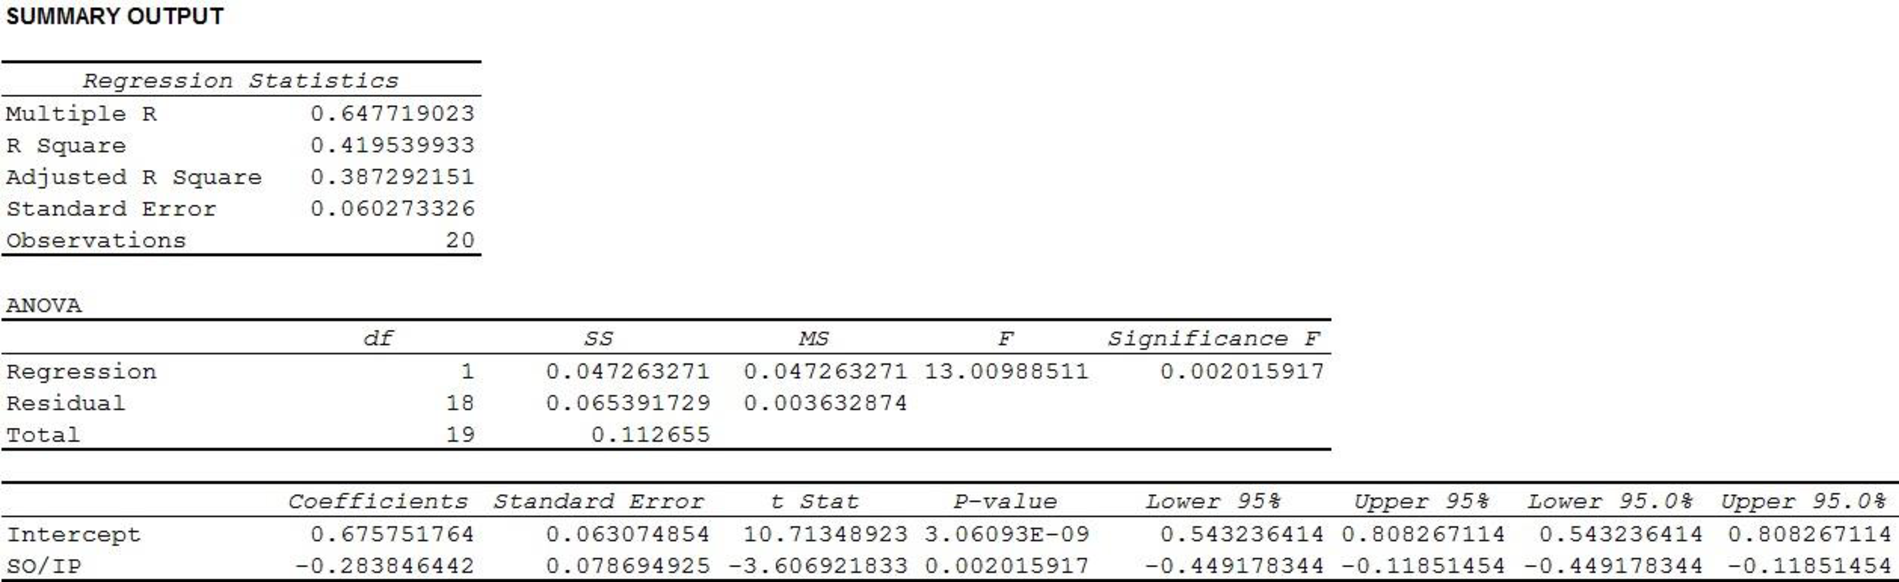
Thus, the estimated regression equation that could be used to predict the average number of runs given up per inning, when the average number of strikeouts per innings pitched is given is
b.
Find the estimated regression equation that could be used to predict the average number of runs given the average number of home runs per innings pitched.
Answer to Problem 10E
The estimated regression equation that could be used to predict the average number of runs given the average number of home runs per innings pitched is
Explanation of Solution
Calculation:
The regression equation can be obtained using EXCEL software.
Software procedure:
Step-by-step procedure to get regression equation using EXCEL software:
- Open an EXCEL sheet and enter the data of W, L, ERA, SO/IP, HR/IP and R/IP corresponding to columns A, B, C, D, E and F, respectively.
- Select Data > Data Analysis > Regression.
- Click OK.
- Under Input Y Range enter $F$1:$F$21.
- Under Input X Range enter $E$1:$E$21.
- Click the box of Labels.
- Under Output Range enter $L$1.
- Click OK.
The output using EXCEL software is given as,
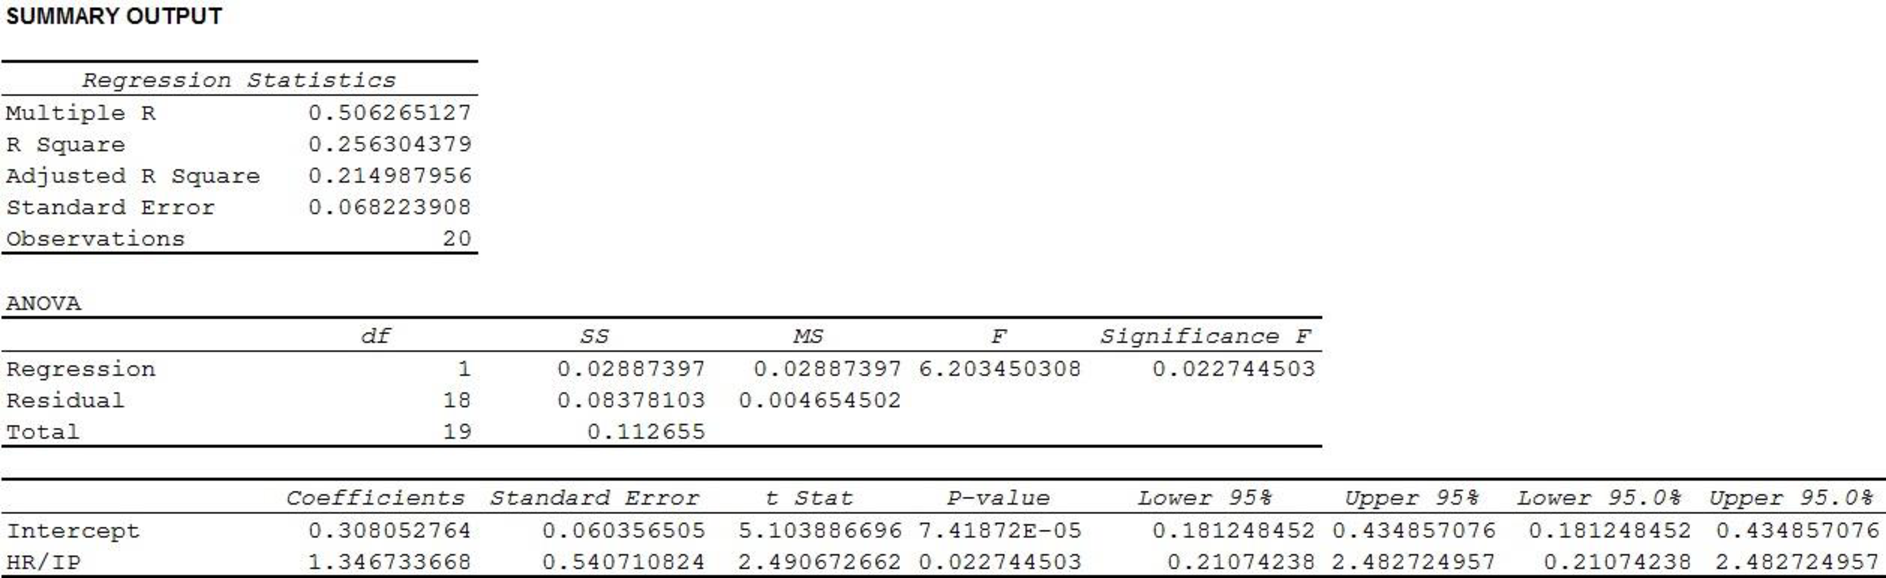
Thus, the estimated regression equation that could be used to predict the average number of runs given the average number of home runs per innings pitched is
c.
Find the estimated regression equation that could be used to predict the average number of runs given the average number of strikeouts per innings pitched and the average number of home runs per innings pitched.
Answer to Problem 10E
The estimated regression equation that could be used to predict the average number of runs given the average number of strikeouts per innings pitched and the average number of home runs per innings pitched is
Explanation of Solution
Calculation:
The regression equation can be obtained using EXCEL software.
Software procedure:
Step-by-step procedure to get regression equation using EXCEL software:
- Open an EXCEL sheet and enter the data of W, L, ERA, SO/IP, HR/IP and R/IP corresponding to columns A, B, C, D, E and F, respectively.
- Select Data > Data Analysis > Regression.
- Click OK.
- Under Input Y Range enter $F$1:$F$21.
- Under Input X Range enter $D$1:$E$21.
- Click the box of Labels.
- Under Output Range enter $O$1.
- Click OK.
The output using EXCEL software is given as,
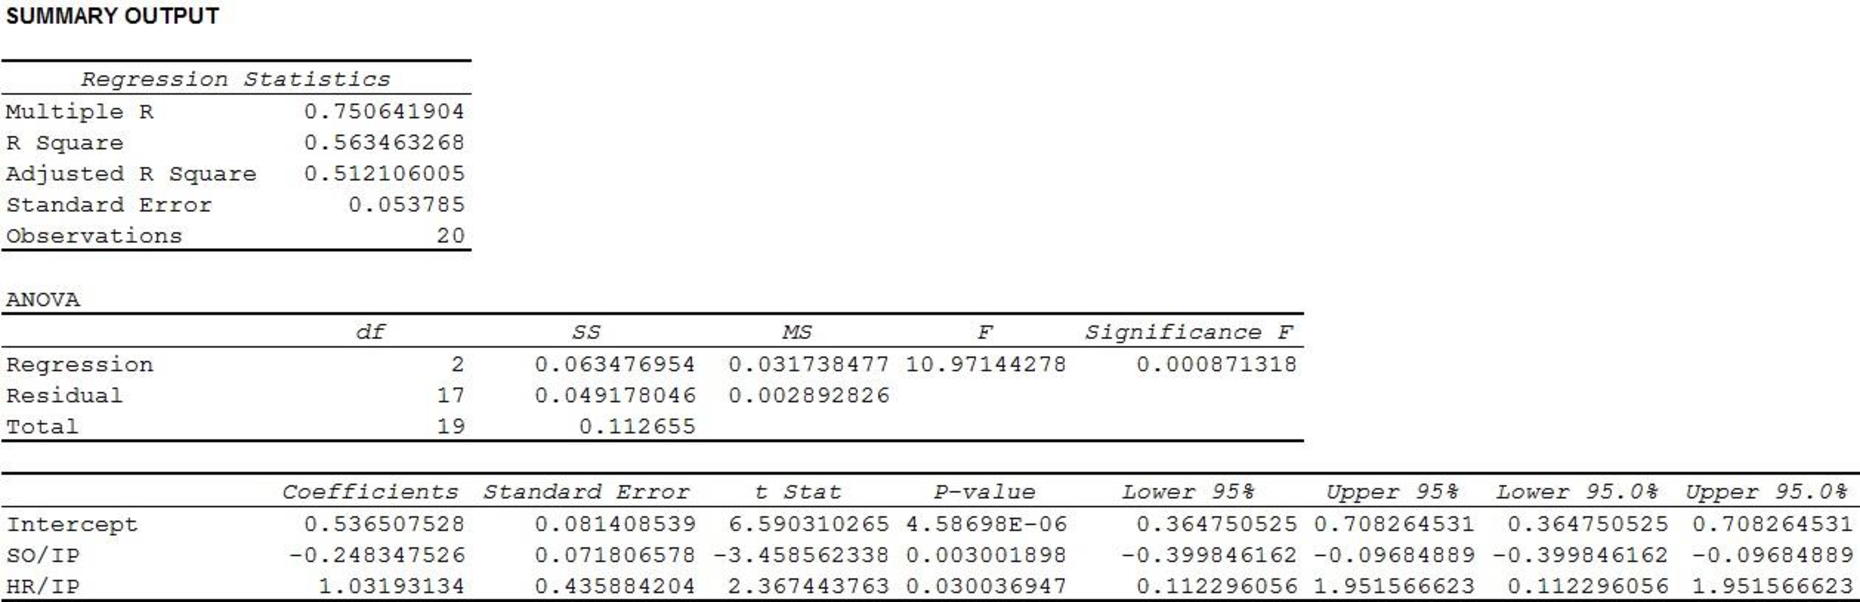
Thus, the estimated regression equation that could be used to predict the average number of runs given the average number of strikeouts per innings pitched and the average number of home runs per innings pitched is
d.
Predict the average number of runs given up per inning for Pitcher A using the regression equation of Part c.
Answer to Problem 10E
The predicted average number of runs given up per inning for Pitcher A is 0.4757.
Explanation of Solution
Calculation:
The average number of strikeouts and the average number of home runs per innings pitched for Pitcher A are 0.91 and 0.16, respectively.
From Part (c), it is found that estimated regression equation that could be used to predict the average number of runs given the average number of strikeouts per innings pitched and the average number of home runs per innings pitched is
Thus, using the given information, the predicted average number of runs given up per inning for Pitcher At is calculated below.
Thus, the predicted average number of runs given up per inning for Pitcher A is 0.4757.
It is to be noted that the actual average number of runs given up per inning for Pitcher A was 0.6.
Thus, the predicted value is slightly less than the actual value. Hence, the residual is positive, which underestimates the model slightly.
e.
Explain about the suggestion to use the earned run average as another independent variable in the regression model developed in Part c.
Explanation of Solution
Calculation:
It would be useful to use the earned run average or ERA as a third independent variable, only if it has a strong linear association with the response variable, R/IP. The correlation coefficient measures the strength of the linear relation between two variables.
Software procedure:
Step-by-step procedure to get correlation coefficient using EXCEL software:
- Open an EXCEL sheet and enter the data of W, L, ERA, SO/IP, HR/IP and R/IP corresponding to columns A, B, C, D, E and F, respectively.
- In cell I1 enter the formula =CORREL(F1:F21,C1:C21).
- Press Enter.
The EXCEL output is given as follows:
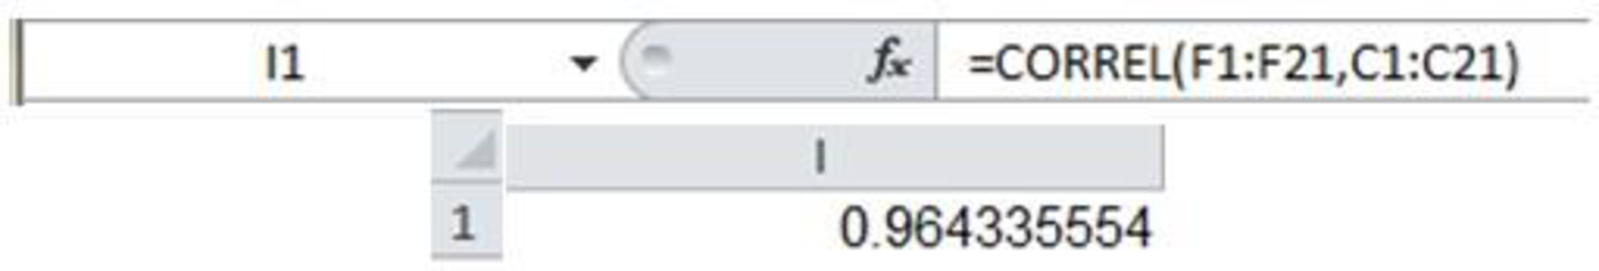
Thus, the correlation coefficient between R/IO and ERA is approximately 0.964, which is very close to 1, indicating a very strong positive linear relationship between the variables.
Due to the high correlation coefficient it can be said that if a pitcher gives up more runs per inning, then the pitcher’s run average also increases. Thus, automatically there will be high value of the coefficient of determination in the regression analysis, if ERA is used as a predictor variable.
Thus, it is reasonable to use the earned run average as another independent variable in the regression model developed in Part c.
Want to see more full solutions like this?
Chapter 15 Solutions
Essentials Of Statistics For Business & Economics


 Functions and Change: A Modeling Approach to Coll...AlgebraISBN:9781337111348Author:Bruce Crauder, Benny Evans, Alan NoellPublisher:Cengage Learning
 Linear Algebra: A Modern IntroductionAlgebraISBN:9781285463247Author:David PoolePublisher:Cengage Learning
 Glencoe Algebra 1, Student Edition, 9780079039897...AlgebraISBN:9780079039897Author:CarterPublisher:McGraw Hill