
Concept explainers
Videos
R2 in Predicting Baseball Pitcher Performance. Refer to exercise 10, where Major League Baseball (MLB) pitching statistics were reported for a random sample of 20 pitchers from the American League for one full season.
- a. In part (c) of exercise 10, an estimated regression equation was developed relating the average number of runs given up per inning pitched given the average number of strikeouts per inning pitched and the average number of home runs per inning pitched. What are the values of R2 and
- b. Does the estimated regression equation provide a good fit to the data? Explain.
- c. Suppose the earned run average (ERA) is used as the dependent variable in part (c) instead of the average number of runs given up per inning pitched. Does the estimated regression equation that uses the ERA provide a good fit to the data? Explain.
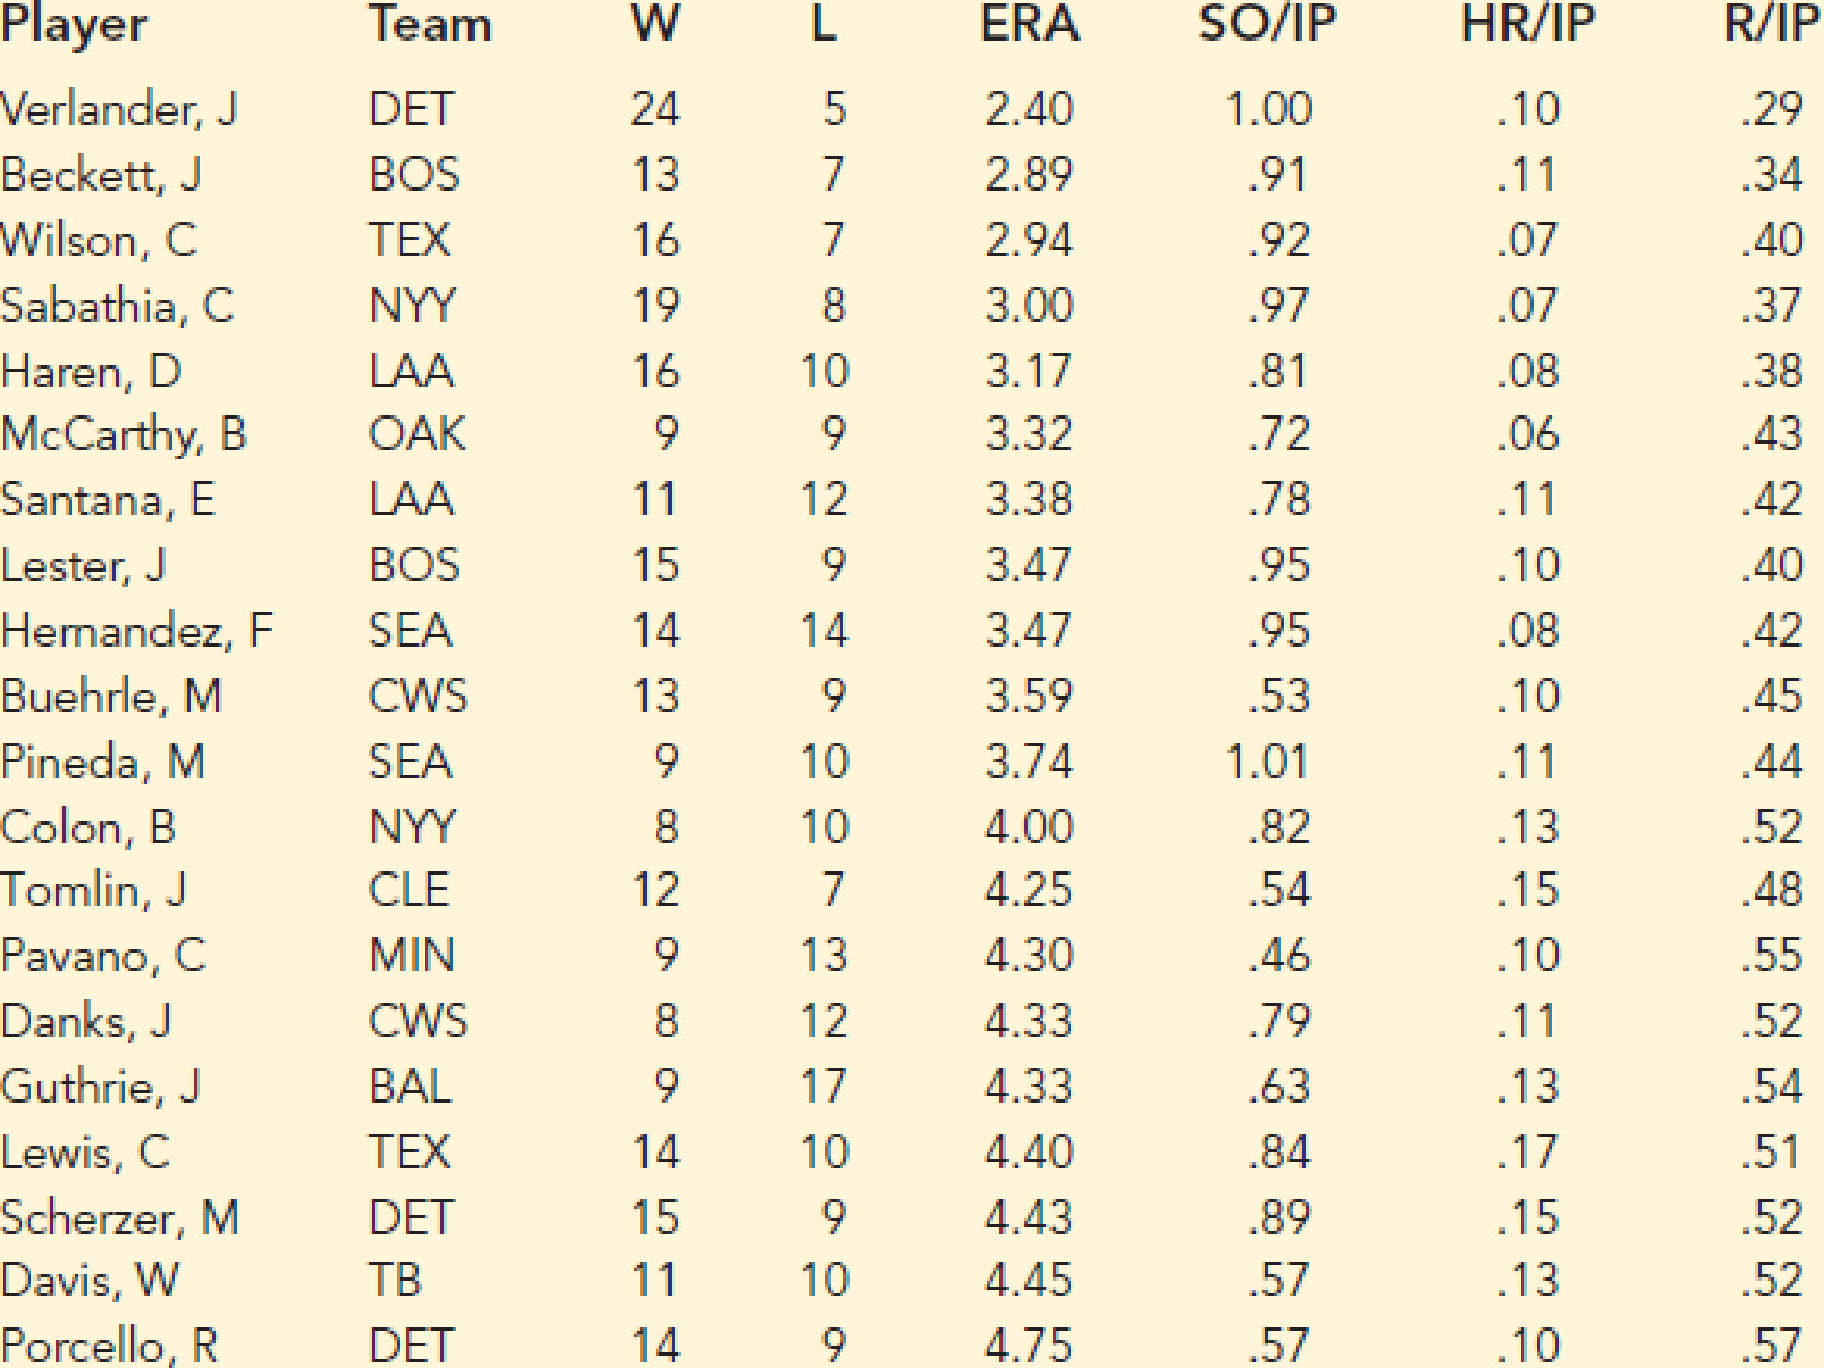
10. Baseball Pitcher Performance. Major League Baseball (MLB) consists of teams that play in the American League and the National League. MLB collects a wide variety of team and player statistics. Some of the statistics often used to evaluate pitching performance are as follows:
ERA: The average number of earned runs given up by the pitcher per nine innings. An earned run is any run that the opponent scores off a particular pitcher except for runs scored as a result of errors.
SO/IP: The average number of strikeouts per inning pitched.
HR/IP: The average number of home runs per inning pitched.
R/IP: The number of runs given up per inning pitched.
The following data show values for these statistics for a random sample of 20 pitchers from the American League for a full season.
- a. Develop an estimated regression equation that can be used to predict the average number of runs given up per inning given the average number of strikeouts per inning pitched.
- b. Develop an estimated regression equation that can be used to predict the average number of runs given up per inning given the average number of home runs per inning pitched.
- c. Develop an estimated regression equation that can be used to predict the average number of runs given up per inning given the average number of strikeouts per inning pitched and the average number of home runs per inning pitched.
- d. A. J. Burnett, a pitcher for the New York Yankees, had an average number of strikeouts per inning pitched of .91 and an average number of home runs per inning of .16. Use the estimated regression equation developed in part (c) to predict the average number of runs given up per inning for A. J. Burnett. (Note: The actual value for R/IP was .6.)
- e. Suppose a suggestion was made to also use the earned run average as another independent variable in part (c). What do you think of this suggestion?

Trending nowThis is a popular solution!

Chapter 15 Solutions
Essentials Of Statistics For Business & Economics


- Life Expectancy The following table shows the average life expectancy, in years, of a child born in the given year42 Life expectancy 2005 77.6 2007 78.1 2009 78.5 2011 78.7 2013 78.8 a. Find the equation of the regression line, and explain the meaning of its slope. b. Plot the data points and the regression line. c. Explain in practical terms the meaning of the slope of the regression line. d. Based on the trend of the regression line, what do you predict as the life expectancy of a child born in 2019? e. Based on the trend of the regression line, what do you predict as the life expectancy of a child born in 1580?2300arrow_forwardOlympic Pole Vault The graph in Figure 7 indicates that in recent years the winning Olympic men’s pole vault height has fallen below the value predicted by the regression line in Example 2. This might have occurred because when the pole vault was a new event there was much room for improvement in vaulters’ performances, whereas now even the best training can produce only incremental advances. Let’s see whether concentrating on more recent results gives a better predictor of future records. (a) Use the data in Table 2 (page 176) to complete the table of winning pole vault heights shown in the margin. (Note that we are using x=0 to correspond to the year 1972, where this restricted data set begins.) (b) Find the regression line for the data in part ‚(a). (c) Plot the data and the regression line on the same axes. Does the regression line seem to provide a good model for the data? (d) What does the regression line predict as the winning pole vault height for the 2012 Olympics? Compare this predicted value to the actual 2012 winning height of 5.97 m, as described on page 177. Has this new regression line provided a better prediction than the line in Example 2?arrow_forward
 Functions and Change: A Modeling Approach to Coll...AlgebraISBN:9781337111348Author:Bruce Crauder, Benny Evans, Alan NoellPublisher:Cengage Learning
 College AlgebraAlgebraISBN:9781305115545Author:James Stewart, Lothar Redlin, Saleem WatsonPublisher:Cengage Learning
 Glencoe Algebra 1, Student Edition, 9780079039897...AlgebraISBN:9780079039897Author:CarterPublisher:McGraw Hill