
Videos
With the use of biofuels increasing, investigators are looking for ways in which the wood ash that is a byproduct of biomass combustion can be used.
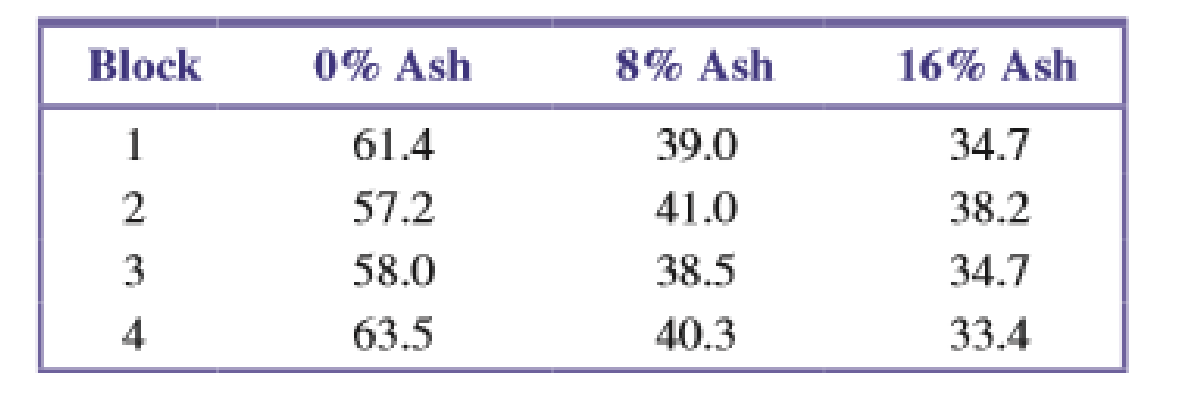
An experiment described in the paper “Wood Ash Admixture to Organic Wastes Improves Compost and Its Performance” (Agriculture, Ecosystems & Environment [2008]: 43–49) looked at the effect of using wood ash in compost. Composts with 0%, 8%, and 16% ash were applied to plots in an experimental field. The plots were grouped into four blocks to create blocks that consisted of plots with similar soil characteristics. Treatments (the three composts) were assigned at random to the plots within each block. At the end of the composting period, the concentration of lead (mg/kg) was measured.
Use the accompanying data (consistent with summary quantities given in the paper) to determine if there is evidence that the mean lead concentration differs for the three ash concentrations. Use α = 0.01.

Trending nowThis is a popular solution!

Chapter 15 Solutions
Introduction To Statistics And Data Analysis


- Since its removal from the banned substances list in 2004 by the World Anti-Doping Agency,caffeine has been used by athletes with the expectancy that it enhances their workout andperformance. However, few studies look at the role caffeine plays in sedentary females.Researchers at the University of Western Australia conducted a test in which they determined therate of energy expenditure (kilojoules) on 10 healthy, sedentary females who were nonregularcaffeine users. Each female was randomly assigned either a placebo or caffeine pill (6mg/kg) 60minutes prior to exercise. The subject rode an exercise bike for 15 minutes at 65% of theirmaximum heart rate, and the energy expenditure was measured. The process was repeated on aseparate day for the remaining treatment. The mean difference in energy expenditure (caffeine –placebo) was 18kJ with a standard deviation of 19kJ. If we assume that the differences follow anormal distribution can it be concluded that that caffeine appears to increase…arrow_forwardSuppose that, as part of a research methods class, Bailey was asked to write a summary of a research paper on the topic of the effects of oil contamination in soil on seed germination rates. Identify the explanatory and the response variables.arrow_forwardA psychologist conducts a 2 x 3 x 2 ANOVA. How many main effects are possible? How many interactions are possible?arrow_forward
- An automotive engineer is investigating two different types of metering devices for an electronic fuel injection system to determine whether they differ in their fuel mileage performance. The system is installed on 10 different cars, and a test is run with each metering device on each car. The data is provided below: Metering Device Car 1 2 1 17.6 16.8 2 19.4 20.0 3 18.2 17.6 4 17.1 16.4 5 15.3 16.0 6 15.9 15.9 7 16.3 16.5 8 18.0 18.4 9 17.3 16.4 10 19.1 20.1 Is there a significant difference between the means of the two metering devices? Use . Interpret the result in the context of the problem. An article in the journal Hazardous Waste and Hazardous Materials (Vol. 6, 1989) reported the results of an analysis of the weight of calcium in standard cement and cement doped with lead. Reduced levels of calcium would indicate that the hydration mechanism in the cement is blocked…arrow_forwardResearchers investigated the possible beneficial effect on heart health of crinking black tea and whether adding mikk to the tea reduces any possible benefit Tiventy-four volunteers Were randomly assigned to one of three groups Every day for month; participants in group drank twvo cups ofhot black tea without mikk; participants in group drank two cups of hot black tea with milk; and participants in group drank twvo cups ofhot water but no tea At the end of the month the fesearchers measured the change in each of the participants heart health. Is it reasonable to zeneralize the study beyond the 24 participants? Explain why or why not.arrow_forwardA suburban hotel derives its revenue from its hotel and restaurant operations. Theowners are interested in the relationship between the number of rooms occupied on anightly basis and the revenue per day in the restaurant. Below is a sample of 25 days(Monday through Thursday) from last year showing the restaurant income and numberof rooms occupied.arrow_forward
- A researcher obtains t(20) = 2.00 and MD = 9 for a repeated-measures study. If the researcher measures effect size using the percentage of variance accounted for, what value will be obtained for r2?arrow_forwardfor an experiment involving 3 levels of factor A and 3 levels of factor B with a sample of n=8 in each treatment condition, what are the df values for the F-factor for the A * B (A multiplied by B) interaction?arrow_forwardThe effects of developer strength (factor A) and development time (factor B) on the density of photographic plate film were being studied. Two strengths and two development times were used, and four replicates in each of the four cells were evaluated. The results (with larger being best) are shown in the following table: At the 0.05 level of significance, a. is there an interaction between developer strength and development time? b. is there an effect due to developer strength? c. is there an effect due to development time?arrow_forward
- A large manufacturing company investigated the service it received from its suppliers and discovered that, in the past, 38% of all material shipments were received late. However, the company recently installed a just-in-time system in which suppliers are linked more closely to the manufacturing process. A random sample of 150 deliveries since the just-in-time system was installed reveals that 33 deliveries were late. If we want to test whether the proportion of late deliveries was reduced signicantly at = 0:10 the null and alternative hypotheses are a. Null hypothesis (H0) b. Alternative hypothesis (HA)arrow_forwardDoes posting calorie content for menu items affectpeople’s choices in fast-food restaurants? According to results obtained by Elbel, Gyamfi, and Kersh(2011), the answer is no. The researchers monitoredthe calorie content of food purchases for children andadolescents in four large fast-food chains before andafter mandatory labeling began in New York City. Although most of the adolescents reported noticing thecalorie labels, apparently the labels had no effect ontheir choices. Data similar to the results obtained showan average of M = 786 calories per meal with s =85 for n =100 children and adolescents before thelabeling, compared to an average of M = 772 calorieswith s = 91 for a similar sample of n = 100 after themandatory posting.a. Use a two-tailed test with a = .05 to determinewhether the mean number of calories after theposting is significantly different than before caloriecontent was posted.b. Calculate r2to measure effect size for the mean difference.arrow_forwardA sample of men and women who had passed their driver's test either the first time or the second time were surveyed, with the following results: Results of the driving testGender First time Second timeMen 126 211Women 135 178a) Do these data suggest that there is a relationship between gender and the passing of their driver’s test from which the present sample was drawn? Let alpha=.05arrow_forward
 MATLAB: An Introduction with ApplicationsStatisticsISBN:9781119256830Author:Amos GilatPublisher:John Wiley & Sons Inc
 Probability and Statistics for Engineering and th...StatisticsISBN:9781305251809Author:Jay L. DevorePublisher:Cengage Learning
 Statistics for The Behavioral Sciences (MindTap C...StatisticsISBN:9781305504912Author:Frederick J Gravetter, Larry B. WallnauPublisher:Cengage Learning
 Elementary Statistics: Picturing the World (7th E...StatisticsISBN:9780134683416Author:Ron Larson, Betsy FarberPublisher:PEARSON
 The Basic Practice of StatisticsStatisticsISBN:9781319042578Author:David S. Moore, William I. Notz, Michael A. FlignerPublisher:W. H. Freeman
 Introduction to the Practice of StatisticsStatisticsISBN:9781319013387Author:David S. Moore, George P. McCabe, Bruce A. CraigPublisher:W. H. Freeman