
Statistics for Business & Economics, Revised (MindTap Course List)
12th Edition
ISBN: 9781285846323
Author: David R. Anderson, Dennis J. Sweeney, Thomas A. Williams, Jeffrey D. Camm, James J. Cochran
Publisher: South-Western College Pub
expand_more
expand_more
format_list_bulleted
Concept explainers
Videos
Textbook Question
Chapter 15.5, Problem 24E
The Wall Street Journal conducted a study of basketball spending at top colleges. A portion of the data showing the revenue ($ millions), percentage of wins, and the coach’s salary ($ millions) for 39 of the country’s top basketball programs follows (The Wall Street Journal, March 11–12, 2006).
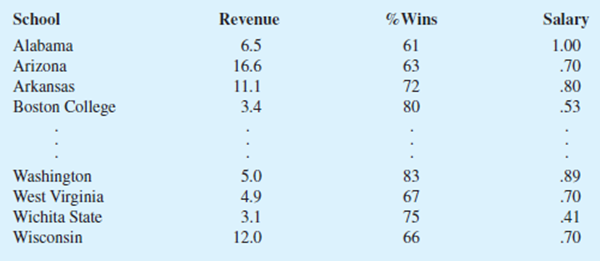
- a. Develop the estimated regression equation that can be used to predict the coach’s salary given the revenue generated by the program and the percentage of wins.
- b. Use the F test to determine the overall significance of the relationship. What is your conclusion at the .05 level of significance?
- c. Use the t test to determine the significance of each independent variable. What is your conclusion at the .05 level of significance?
Expert Solution & Answer
Want to see the full answer?
Check out a sample textbook solution
Students have asked these similar questions
The city wants to further develop the model to include the weather conditions of rainy, cloudy, or sunny.
Ice Rink Attendance
Temperature (°F)
Weather Condition
140
45
Sunny
110
40
Cloudy
135
50
Cloudy
120
40
Cloudy
165
45
Sunny
180
45
Sunny
210
50
Sunny
190
45
Cloudy
170
40
Cloudy
130
45
Rainy
140
45
Cloudy
80
35
Rainy
120
45
Cloudy
100
45
Rainy
What is the regression equation?
Use the equation to forecast ice rink attendance if the temperature is 38°F and sunny.
Should you keep weather condition in the model?
A shoe store developed the following estimated regression equation relating sales to inventory investment and advertising expenditures.
ŷ = 25 + 10x1 + 8x2
where
x1
=
inventory investment ($1,000s)
x2
=
advertising expenditures ($1,000s)
y
=
sales ($1,000s).
(a)
Predict the sales (in dollars) resulting from a $15,000 investment in inventory and an advertising budget of $11,000.
$ -----------------
(b)
Interpret
b1 and b2 in this estimated regression equation.
Sales can be expected to increase by $ ---------------for every dollar increase in inventory investment when advertising expenditure is held constant.
Sales can be expected to increase by $-----------------for every dollar increase in advertising expenditure when inventory investment is held constant.
Create the regression equations based on the research model below!
Chapter 15 Solutions
Statistics for Business & Economics, Revised (MindTap Course List)
Ch. 15.2 - The estimated regression equation for a model...Ch. 15.2 - Consider the following data for a dependent...Ch. 15.2 - In a regression analysis involving 30...Ch. 15.2 - A shoe store developed the following estimated...Ch. 15.2 - The owner of Showtime Movie Theaters, Inc., would...Ch. 15.2 - The National Football League (NFL) records a...Ch. 15.2 - PC World rated four component characteristics for...Ch. 15.2 - The Cond Nast Traveler Gold List provides ratings...Ch. 15.2 - Waterskiing and wakeboarding are two popular...Ch. 15.2 - Prob. 10E
Ch. 15.3 - In exercise 1, the following estimated regression...Ch. 15.3 - Prob. 12ECh. 15.3 - In exercise 3, the following estimated regression...Ch. 15.3 - In exercise 4, the following estimated regression...Ch. 15.3 - In exercise 5, the owner of Showtime Movie...Ch. 15.3 - In exercise 6, data were given on the average...Ch. 15.3 - Prob. 17ECh. 15.3 - Prob. 18ECh. 15.5 - In exercise 1, the following estimated regression...Ch. 15.5 - Refer to the data presented in exercise 2. The...Ch. 15.5 - The following estimated regression equation was...Ch. 15.5 - In exercise 4, the following estimated regression...Ch. 15.5 - Prob. 23ECh. 15.5 - The Wall Street Journal conducted a study of...Ch. 15.5 - The Cond Nast Traveler Gold List for 2012 provided...Ch. 15.5 - In exercise 10, data showing the values of several...Ch. 15.6 - In exercise 1, the following estimated regression...Ch. 15.6 - Refer to the data in exercise 2. The estimated...Ch. 15.6 - In exercise 5, the owner of Showtime Movie...Ch. 15.6 - Prob. 30ECh. 15.6 - The American Association of Individual Investors...Ch. 15.7 - Consider a regression study involving a dependent...Ch. 15.7 - Consider a regression study involving a dependent...Ch. 15.7 - Management proposed the following regression model...Ch. 15.7 - Refer to the Johnson Filtration problem introduced...Ch. 15.7 - This problem is an extension of the situation...Ch. 15.7 - The Consumer Reports Restaurant Customer...Ch. 15.7 - A 10-year study conducted by the American Heart...Ch. 15.8 - Data for two variables, x and y, follow. xi 1 2 3...Ch. 15.8 - Data for two variables, x and y, follow. xi 22 24...Ch. 15.8 - Exercise 5 gave the following data on weekly gross...Ch. 15.8 - The following data show the curb weight,...Ch. 15.8 - Prob. 43ECh. 15.9 - Refer to the Simmons Stores example introduced in...Ch. 15.9 - In Table 15.12 we provided estimates of the...Ch. 15.9 - Community Bank would like to increase the number...Ch. 15.9 - Over the past few years the percentage of students...Ch. 15.9 - The Tire Rack maintains an independent consumer...Ch. 15 - The admissions officer for Clearwater College...Ch. 15 - The personnel director for Electronics Associates...Ch. 15 - A partial computer output from a regression...Ch. 15 - Recall that in exercise 49, the admissions officer...Ch. 15 - Recall that in exercise 50 the personnel director...Ch. 15 - The Tire Rack, Americas leading online distributor...Ch. 15 - The Department of Energy and the U.S....Ch. 15 - A portion of a data set containing information for...Ch. 15 - Fortune magazine publishes an annual list of the...Ch. 15 - Consumer Research, Inc., is an independent agency...Ch. 15 - Matt Kenseth won the 2012 Daytona 500, the most...Ch. 15 - Finding the Best Car Value When trying to decide...
Knowledge Booster


Learn more about
Need a deep-dive on the concept behind this application? Look no further. Learn more about this topic, statistics and related others by exploring similar questions and additional content below.Similar questions
- A study was conducted to detemine whether a the final grade of a student in an introductory psychology course is linearly related to his or her performance on the verbal ability test administered before college entrance. The verbal scores and final grades for 10 students are shown in the table below. Student Verbal Score x Final Grade y 1 37 43 2 38 46 3 33 39 4 57 67 5 60 74 6 64 80 7 47 59 8 66 76 9 28 30 10 53 62 Should the regression be used to predict the final grade of a student with a verbal score of 100? answer: ?arrow_forwardThe following data show the brand, price($), and the overall score for 6 stereo headphones that were tested by Consumer Reports. The overall score is based on sound quality and effectiveness of ambient noise reduction. Scores range from 0 (lowest) to 100 (highest). The estimated regression equation for these data is y=23.043+2.7x , where x=price and y=overall score . Brand Price Score Bose 170 75 Scullcandy 160 71 Koss 95 62 Phillips/O'Neill 70 56 Denon 60 40 JVC 45 26 Round your answers to three decimal places. a. Compute SST,SSR , and SSE. SST (to 3 decimals) SSR (to 3 decimals) SSE (to 3 decimals) c. What is the value of the sample correlation coefficient? rxy=arrow_forwardTo determine if the listing price of a house influences the selling price; a financial analyst sampled fifty houses and collected data on sale price,Y,(in $’000) and listed price,X,(in$’000) and fitted a regression model to the dataarrow_forward
- A real estate agency collects data concerning the sales of a house (in thousands of dollars) and the home size (in hundreds of square feet). The data are given in the table below. Sales Price (Y, $1,000) Home Size (X, 100 sf)______ 180 23 98.1 11 173.1 20 136.5 17 141 15 165.9 21 193.5 24 127.8 13…arrow_forward(a) For United States, provide data for the variables below over the years 1993 –2007:(i) Net migration rate (per 1,000 population)(ii) Total fertility rate (live births per woman)(iii)Unemployment, general level (Thousands)(iv) Wages(v) Life expectancy at birth for both sexes combined (years)Data can be obtained from the UN database http://data.un.org/Explorer.aspxUsing R-Studio, estimate a regression equation to determine the effect of unemployment,general level, wages and life expectancy at birth for both sexes on the net migration rate.(All codes and regression output should be provided).(i) Write down the regression equation. (ii) Interpret the coefficients and determine which of the individual coefficients in theregression model are statistically significant. In responding, construct and test anyappropriate hypothesis. (iii) Interpret the coefficient of determination.arrow_forwardA statistics consulting center at a major university analyzed data on normal woodchucks for the university's veterinary school. The variables of interest were body weight in grams and heart weight in grams. It was desired to develop a linear regression equation in order to determine if there is a significant linear relationship between heart weight and total body weight. Use this information to answer the questions. Determine the test statistic. Body Weight Heart Weight4050 11.12435 10.13135 15.85740 10.92555 10.73665 11.42035 13.44260 13.92990 11.54935 15.83690 10.12880 12.82760 10.62160 15.42360 14.82040 13.62055 12.92650 15.62665 13.8arrow_forward
- The table contains data on vehicle speed (h) and fuel consumption (lt / 100km) of 5 randomly selected vehicles. Estimate the average fuel consumption of a vehicle traveling at 45 km / h using the simple linear regression equation between vehicle speed and fuel consumption. Speed 55 60 65 70 75 Consumption 11 10 9 8 7 Please choose one: a. 6 b. 5 c. 13 D. 8arrow_forwarda) For United States, provide data for the variables below over the years 1993 – 2007: (i) Net migration rate (per 1,000 population) (ii) Total fertility rate (live births per woman) (iii)Unemployment, general level (Thousands) (iv) Wages (v) Life expectancy at birth for both sexes combined (years) Data can be obtained from the UN database http://data.un.org/Explorer.aspx Using R-Studio, estimate a regression equation to determine the effect of unemployment, general level, wages and life expectancy at birth for both sexes on the net migration rate. (All codes and regression output should be provided).(i) Write down the regression equation. (ii) Interpret the coefficients and determine which of the individual coefficients in theregression model are statistically significant. In responding, construct and test anyappropriate hypothesis. (iii) Interpret the coefficient of determination. (iv) Using the 10% level of significance, determine and discuss whether the overallregression equation…arrow_forward(a) For United States, provide data for the variables below over the years 1993 – 2007: (i) Net migration rate (per 1,000 population) (ii) Total fertility rate (live births per woman) (iii)Unemployment, general level (Thousands) (iv) Wages (v) Life expectancy at birth for both sexes combined (years) Data can be obtained from the UN database http://data.un.org/Explorer.aspx Using R-Studio, estimate a regression equation to determine the effect of unemployment, general level, wages and life expectancy at birth for both sexes on the net migration rate. (All codes and regression output should be provided).(b) Using R-Studio redo the regression analysis with the total fertility rate as an additionalindependent variable. (All codes and regression output should be provided).(i) Write down the regression equation. (ii) Use the 5% level of significance, determine and discuss whether the total fertilityrate has a significant impact on the net migration rate in your assigned country.…arrow_forward
- (a) For United States, provide data for the variables below over the years 1993 – 2007: (i) Net migration rate (per 1,000 population) (ii) Total fertility rate (live births per woman) (iii)Unemployment, general level (Thousands) (iv) Wages (v) Life expectancy at birth for both sexes combined (years) Data can be obtained from the UN database http://data.un.org/Explorer.aspx Using R-Studio, estimate a regression equation to determine the effect of unemployment, general level, wages and life expectancy at birth for both sexes on the net migration rate. (All codes and regression output should be provided). (iv) Using the 10% level of significance, determine and discuss whether the overall regression equation is statistically significant. In responding, construct and test any appropriate hypothesis. (v) Determine and interpret the confidence interval for the independent variable(s).arrow_forwardThe following data show the brand, price ($), and the overall score for six stereo headphones that were tested by Consumer Reports (Consumer Reports website, March 5, 2012). The overall score is based on sound quality and effectiveness of ambient noise reduction. Scores range from 0 (lowest) to 100 (highest). The estimated regression equation for these data is ŷ = 23.194 + .318x, where x = price ($) and y = overall score. Brand Price ($) Score Bose 180 76 Skulllcandy 150 71 Koss 95 61 Phillips /O'Neill 70 56 Denon 70 40 JVC 35 26 a. Compute SST, SSR, and SSE.b. Compute the coefficient of determination r2. Comment on the goodness of fit.c. What is the value of the sample correlation coefficient?arrow_forwardTo determine the effectiveness of group study sessions, a college instructor gathers data on hours of attendance and exam scores for students in the class. Which variable, hours of attendance or exam scores, would be the response variable for a least-squares regression equation? is it hours of attendance or exam scores?arrow_forward
arrow_back_ios
SEE MORE QUESTIONS
arrow_forward_ios
Recommended textbooks for you
 MATLAB: An Introduction with ApplicationsStatisticsISBN:9781119256830Author:Amos GilatPublisher:John Wiley & Sons Inc
 Probability and Statistics for Engineering and th...StatisticsISBN:9781305251809Author:Jay L. DevorePublisher:Cengage Learning
 Statistics for The Behavioral Sciences (MindTap C...StatisticsISBN:9781305504912Author:Frederick J Gravetter, Larry B. WallnauPublisher:Cengage Learning
 Elementary Statistics: Picturing the World (7th E...StatisticsISBN:9780134683416Author:Ron Larson, Betsy FarberPublisher:PEARSON
 The Basic Practice of StatisticsStatisticsISBN:9781319042578Author:David S. Moore, William I. Notz, Michael A. FlignerPublisher:W. H. Freeman
 Introduction to the Practice of StatisticsStatisticsISBN:9781319013387Author:David S. Moore, George P. McCabe, Bruce A. CraigPublisher:W. H. Freeman
MATLAB: An Introduction with Applications
Statistics
ISBN:9781119256830
Author:Amos Gilat
Publisher:John Wiley & Sons Inc
Probability and Statistics for Engineering and th...
Statistics
ISBN:9781305251809
Author:Jay L. Devore
Publisher:Cengage Learning
Statistics for The Behavioral Sciences (MindTap C...
Statistics
ISBN:9781305504912
Author:Frederick J Gravetter, Larry B. Wallnau
Publisher:Cengage Learning
Elementary Statistics: Picturing the World (7th E...
Statistics
ISBN:9780134683416
Author:Ron Larson, Betsy Farber
Publisher:PEARSON
The Basic Practice of Statistics
Statistics
ISBN:9781319042578
Author:David S. Moore, William I. Notz, Michael A. Fligner
Publisher:W. H. Freeman
Introduction to the Practice of Statistics
Statistics
ISBN:9781319013387
Author:David S. Moore, George P. McCabe, Bruce A. Craig
Publisher:W. H. Freeman
Correlation Vs Regression: Difference Between them with definition & Comparison Chart; Author: Key Differences;https://www.youtube.com/watch?v=Ou2QGSJVd0U;License: Standard YouTube License, CC-BY
Correlation and Regression: Concepts with Illustrative examples; Author: LEARN & APPLY : Lean and Six Sigma;https://www.youtube.com/watch?v=xTpHD5WLuoA;License: Standard YouTube License, CC-BY