Concept explainers
Videos
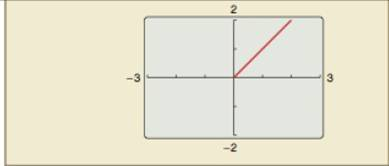
HOW DO YOU SEE IT? The figure below shows the graph of
Sound Intensity In Exercises 129 and 130, use the following information. The relationship between the number of decibels
Want to see the full answer?
Check out a sample textbook solution
Chapter 1 Solutions
Calculus: Early Transcendental Functions


- Drug Concentration When a drug is administered orally, it takes some time before the blood concentration reaches its maximum level. After that time, concentration levels decrease. When 500 milligrams of procainamide is administered orally, one model for a particular patient gives blood concentration C, in milligrams per liter, after t hours as C=2.65(e0.2te2t) What is the maximum blood-level concentration, and when does that level occur?arrow_forwardpH The hydrogen ion concentration of fresh egg whites was measured as [H+]=1.3x10⁸M Find the pH, and classify the substance as acidic or basic.arrow_forwardStopping distance, The stopping distance of an automobile is the distance travelled during the driver’s reaction time plus the distance travelled after the driver applies the brakes. In an experiment, researchers measured these distances (in feet) when the automobile was traveling at a speed of x. miles per hour on dry, level pavement, as shown in the bar graph. The distance travelled during the reaction time R was R=1.1x and the braking distance B was B=0.0475x20.001x+0.23. (a) Determine the polynomial that represents the total stopping distance T. (b) Use the result of part (a) to estimate the total stopping distance when x=30,x=40, andx=55 miles per hour. (c) Use the bar graph to make a statement about the total stopping distance required forincreasing speeds.arrow_forward
- Finding pH the hydrogen ion concentrations in cheese range from 4.0x10⁻⁷ M tp 1.6x10⁻⁵M. Find The corresponding range of pH readings.arrow_forwardpH of calcium hydroxide Find the hydrogen ion concentration of a saturated solution of calcium hydroxide whose pH is 13.2arrow_forwardPopulation Statistics The table shows the life expectancies of a child (at birth) in the United States for selected years from 1940 through 2010. A model for the life expectancy during this period is y=63.6+0.97t1+0.01t,0t70 Where y represents the life expectancy and t is the time in years, with t = 0 corresponding to 1940. (a) Use a graphing utility to graph the data from the table and the model in the same viewing window. How well does the model fit the data? Explain. (b) Determine the life expectancy in 1990 both graphically and algebraically. (c) Use the graph to determine the year when life expectancy was approximately 70.1. verify your answer algebraically. (d) Find the y-intercept of the graph of the model. What does it represent in the context of the problem? (e) Do you think this model can be used to predict the life expectancy of a child 50 years from now?arrow_forward
 College AlgebraAlgebraISBN:9781305115545Author:James Stewart, Lothar Redlin, Saleem WatsonPublisher:Cengage Learning
 Algebra & Trigonometry with Analytic GeometryAlgebraISBN:9781133382119Author:SwokowskiPublisher:Cengage
 Trigonometry (MindTap Course List)TrigonometryISBN:9781337278461Author:Ron LarsonPublisher:Cengage Learning
 Big Ideas Math A Bridge To Success Algebra 1: Stu...AlgebraISBN:9781680331141Author:HOUGHTON MIFFLIN HARCOURTPublisher:Houghton Mifflin Harcourt
 Functions and Change: A Modeling Approach to Coll...AlgebraISBN:9781337111348Author:Bruce Crauder, Benny Evans, Alan NoellPublisher:Cengage Learning