
Concept explainers
Videos
a.
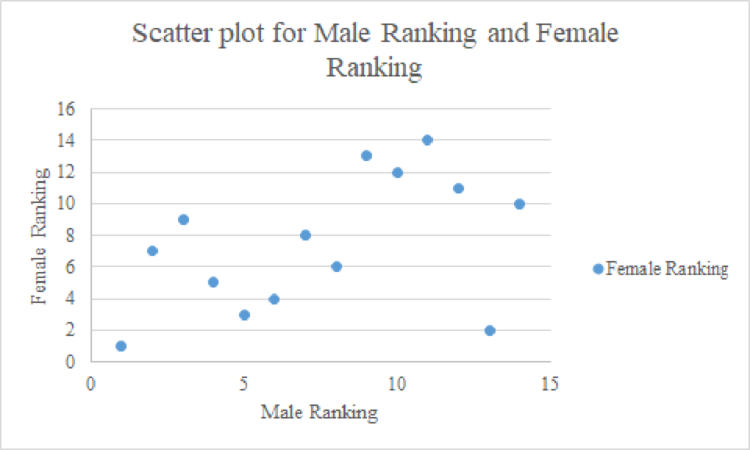
Construct a scatter plot.
a.
Explanation of Solution
The scatter plot for male and female rankings is given below:
Step-by-step procedure to obtain scatter plot using EXCEL:
- Open an EXCEL file.
- In column A, enter the column of Male ranking, in column B enter the column of Female ranking.
- Select the data that is to be displayed.
- Click on Insert > select Scatter icon.
- Click on the chart > select Layout from the Chart Tools.
- Select Chart Title > Above Chart.
- Enter Scatter plot for Male ranking Vs. Female ranking in the dialog box.
- Select Axis Title > Primary Horizontal Axis Title > Title Below Axis.
- Enter Male ranking in the dialog box.
- Select Axis Title > Primary Vertical Axis Title > Rotated Title.
- Enter Female ranking in the dialog box.
Output obtained using EXCEL is given below:
b.
Obtain the coefficient of rank
b.
Answer to Problem 25E
The coefficient of rank correlation between male and female rankings is 0.468.
Explanation of Solution
Where, d is the difference between ranks of each pair.
n is the number of paired observations.
The table represents the difference between ranks of each pair:
|
(1) Program |
(2) Male ranking |
(3) Female ranking |
(4) Rank 1 |
(5) Rank 2 |
(6) Difference, |
(7) |
| 1 | 4 | 5 | 4 | 5 | 1 | |
| 2 | 6 | 4 | 6 | 4 | 4 | |
| 3 | 7 | 8 | 7 | 8 | 1 | |
| 4 | 2 | 7 | 2 | 7 | 25 | |
| 5 | 12 | 11 | 12 | 11 | 1 | |
| 6 | 8 | 6 | 8 | 6 | 4 | |
| 7 | 5 | 3 | 5 | 3 | 4 | |
| 8 | 3 | 9 | 3 | 9 | 36 | |
| 9 | 13 | 2 | 13 | 2 | 121 | |
| 10 | 14 | 10 | 14 | 10 | 16 | |
| 11 | 1 | 1 | 1 | 1 | 0 | |
| 12 | 9 | 13 | 9 | 13 | 16 | |
| 13 | 10 | 12 | 10 | 12 | 4 | |
| 14 | 11 | 14 | 11 | 14 | 9 | |
In this context, the number of paired observation, n is 14.
The Spearman’s coefficient of rank correlation obtained as given below:
Substitute the corresponding values to get the rank correlation.
Thus, the Spearman’s coefficient of rank correlation is 0.468.
The rank correlation value of 0.468 reveals that there is slight positive correlation between male and female rankings.
c.
State whether it can be concluded that there is a positive association between male and female rankings.
c.
Answer to Problem 25E
The conclusion is that, there is no evidence that there is a positive association between male and female rankings.
Explanation of Solution
The test hypothesis is given as follows:
Null hypothesis:
Alternative hypothesis:
In this context, the number of paired observations is 14.
If the sample size is greater than 10, then the sampling distribution of
Hypothesis test for rank correlation:
Degrees of freedom:
Decision rule:
- If
- Otherwise fail to reject the null hypothesis.
In this context, the critical value
From Part (a), the rank correlation,
The test statistic will be obtained as given below:
Substitute
Conclusion:
Here, the test statistic is greater than the critical value.
Therefore, by the decision rule, reject the null hypothesis.
Therefore, there is evidence to support the claim that there is a positive association between male and female rankings.
Want to see more full solutions like this?
Chapter 16 Solutions
EBK STATISTICAL TECHNIQUES IN BUSINESS


 Glencoe Algebra 1, Student Edition, 9780079039897...AlgebraISBN:9780079039897Author:CarterPublisher:McGraw Hill
 Big Ideas Math A Bridge To Success Algebra 1: Stu...AlgebraISBN:9781680331141Author:HOUGHTON MIFFLIN HARCOURTPublisher:Houghton Mifflin Harcourt