
Concept explainers
Videos
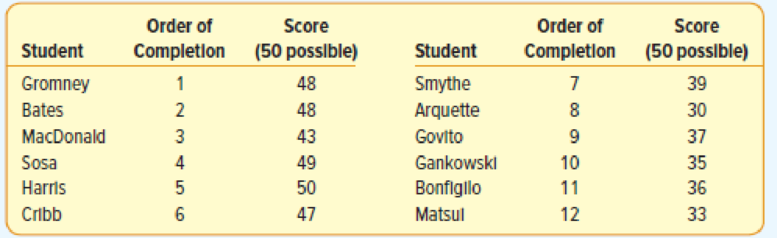
Professor Bert Forman believes the students who complete his examinations in the shortest time receive the highest grades and those who take the longest to complete them receive the lowest grades. To verify his suspicion, he assigns a rank to the order of finish and then grades the examinations. The results are shown below:
Convert the test scores to a rank and find the coefficient of rank
Convert the test scores into ranks:
Obtain the correlation between the rankings of order of completion and test score.
State whether it can be concluded that there is a positive association between the rankings of order of completion and test score.
Answer to Problem 40CE
The correlation between the rankings of the order of completion and test score is 0.788.
The conclusion is that there is evidence that there is a positive association between the rankings of order of completion and test score.
Explanation of Solution
Here, the ranking of the test is done in context with descending order.
The rank of test scores is given below:
| 48 | 48 | 43 | 49 | 50 | 47 | 39 | 30 | 37 | 35 | 36 | 33 |
| 3.5 | 3.5 | 6 | 2 | 1 | 5 | 7 | 12 | 8 | 10 | 9 | 11 |
Spearman’s coefficient of rank correlation:
Where d is the difference between ranks of each pair.
n is the number of paired observations.
The table represents the difference between ranks of each pair:
|
(1) Student |
(2) Rank by Order of completion |
(3) Rank by Score |
(4) Difference, |
(5) |
| 1 | 1 | 3.5 | 6.25 | |
| 2 | 2 | 3.5 | 2.25 | |
| 3 | 3 | 6 | 9 | |
| 4 | 4 | 2 | 4 | |
| 5 | 5 | 1 | 16 | |
| 6 | 6 | 5 | 1 | |
| 7 | 7 | 7 | 0 | |
| 8 | 8 | 12 | 16 | |
| 9 | 9 | 8 | 1 | |
| 10 | 10 | 10 | 0 | |
| 11 | 11 | 9 | 4 | |
| 12 | 12 | 11 | 1 | |
In this context, the number of paired observation, n is 12.
The Spearman’s coefficient of rank correlation is obtained as given below:
Substitute the corresponding values to get the rank correlation.
Thus, the Spearman’s coefficient of rank correlation is 0.788.
The rank correlation value of 0.788 reveals that there is a strong positive correlation between the order of completion and test score.
The test hypotheses are given as follows:
Null hypothesis:
Alternative hypothesis:
If the sample size is greater than 10, then the sampling distribution of
Hypothesis test for rank correlation:
Degrees of freedom:
Decision rule:
- If
- Otherwise fail to reject the null hypothesis.
In this context, the critical value
From Part (a), the rank correlation,
The test statistic will be obtained as given below:
Substitute
Conclusion:
Here, the test statistic is greater than the critical value.
Therefore, by the decision rule, reject the null hypothesis.
Therefore, there is evidence to conclude that there is a positive association between the rankings of order of completion and test score.
Want to see more full solutions like this?
Chapter 16 Solutions
EBK STATISTICAL TECHNIQUES IN BUSINESS


 Glencoe Algebra 1, Student Edition, 9780079039897...AlgebraISBN:9780079039897Author:CarterPublisher:McGraw Hill