
Concept explainers
Videos
a.
Obtain the
State whether it can be concluded that there is a positive association between the rankings of number of wins and total team salary.
a.
Answer to Problem 42DA
The correlation between the rankings of the number of wins and total team salary is 0.727.
The conclusion is that there is evidence that there is a positive association between the number of wins and total team salary.
Explanation of Solution
Here, d is the difference between ranks of each pair.
n is the number of paired observations.
Step-by-step procedure to obtain correlation using MINITAB is given below:
- Select Stat > Basic Statistics > Correlation.
- In Variables, select Wins, and Team salary from the box on the left.
- In drop down box, select Spearman Rho.
- Click OK.
Output obtained using MINITAB is given below:
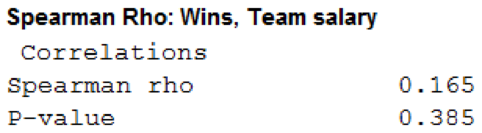
The rank correlation value of 0.165 reveals that there is a slight
The test hypothesis is given as follows:
Null hypothesis:
Alternative hypothesis:
If the sample size is greater than 10, then the sampling distribution of
Hypothesis test for rank correlation:
Degrees of freedom:
Decision rule:
- If
- Otherwise, fail to reject the null hypothesis.
In this context, the critical value
The test statistic will be obtained as follows:
Substitute
Conclusion:
Here, the test statistic is less than the critical value.
Therefore, by the decision rule, fail to reject the null hypothesis.
Therefore, there is no evidence to support the claim that there is a positive association between the rankings of the number of wins and total team salary.
b.
State whether there is a difference between two populations.
b.
Answer to Problem 42DA
There is no difference between two populations.
Explanation of Solution
In this context, 1st population has 15 observations and 2nd population has 15 observations and the assumed significance level is 0.05.
The test hypothesis is given as follows:
Null hypothesis:
Alternative hypothesis:
Decision rule:
- If
- Otherwise, fail to reject the null hypothesis.
In this context, the critical value for
The test statistic will be obtained under the following two categories:
Here,
W is the sum of ranks from the first population.
The table represents the ranks for the two populations:
| American | Rank | National | Rank |
| 118.9 | 18 | 65.8 | 1 |
| 168.7 | 26 | 89.6 | 8 |
| 110.7 | 13 | 117.2 | 16 |
| 87.7 | 7 | 117.7 | 17 |
| 172.8 | 27 | 98.3 | 9 |
| 69.1 | 2 | 230.4 | 30 |
| 112.9 | 14 | 84.6 | 5 |
| 146.4 | 24 | 98.7 | 10 |
| 108.3 | 12 | 100.1 | 11 |
| 213.5 | 29 | 133 | 22 |
| 80.8 | 4 | 85.9 | 6 |
| 123.2 | 20 | 126.6 | 21 |
| 74.8 | 3 | 166.5 | 25 |
| 144.8 | 23 | 120.3 | 19 |
| 116.4 | 15 | 174.5 | 28 |
The sum of the ranks from the first population is as follows:
The test statistic will be obtained as given below:
Substitute W as 237, n1 as 15, and n2 as 15.
Conclusion:
Here, the test statistic is greater than the critical value
Therefore, by the decision rule, fail to reject the null hypothesis.
Therefore, there is no evidence to support the claim that the two populations are different.
c.
Obtain the correlation between the rankings of the attendance and total team salary.
State whether it can be concluded that there is a positive association between the rankings of the attendance and total team salary.
c.
Answer to Problem 42DA
The correlation between the rankings of the attendance and total team salary is 0.727.
The conclusion is that there is evidence that there is a association between the number of attendance and total team salary.
Explanation of Solution
Step-by-step procedure to obtain correlation using MINITAB is given below:
- Select Stat > Basic Statistics > Correlation.
- In Variables, select Attendance, and Team salary from the box on the left.
- In drop down box, select Spearman Rho.
- Click OK.
Output obtained using MINITAB is given below:
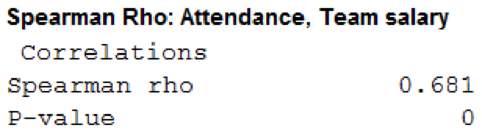
The rank correlation value of 0.681 reveals that there is a positive correlation between rankings of the number of attendance and total team salary.
The test hypothesis is given as follows:
Null hypothesis:
Alternative hypothesis:
If the sample size is greater than 10, then the sampling distribution of
Hypothesis test for rank correlation:
Degrees of freedom:
Decision rule:
- If
- Otherwise, fail to reject the null hypothesis.
In this context, the critical value
The test statistic will be obtained as follows:
Substitute
Conclusion:
Here, the test statistic is greater than the critical value.
Therefore, by the decision rule, reject the null hypothesis.
Therefore, there is enough evidence to support the claim that there is an association between the rankings of the number of attendance and total team salary.
Want to see more full solutions like this?
Chapter 16 Solutions
EBK STATISTICAL TECHNIQUES IN BUSINESS


 Glencoe Algebra 1, Student Edition, 9780079039897...AlgebraISBN:9780079039897Author:CarterPublisher:McGraw Hill