Principles of Accounting
12th Edition
ISBN: 9781133626985
Author: Belverd E. Needles, Marian Powers, Susan V. Crosson
Publisher: Cengage Learning
expand_more
expand_more
format_list_bulleted
Concept explainers
Videos
Textbook Question
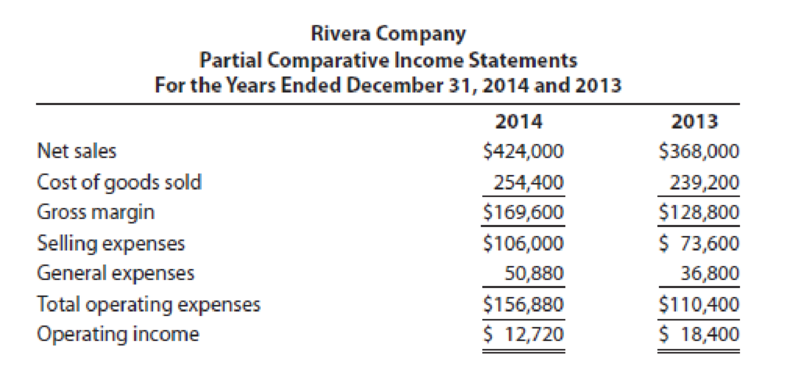
Chapter 16, Problem 4EA
Express Rivera Company’s partial comparative income statements as common-size statements, and comment on the changes from 2013 to 2014.
Expert Solution & Answer
Want to see the full answer?
Check out a sample textbook solution
Students have asked these similar questions
Suppose the following historical data is from the consolidated income statements filed by a media corporation.
*chart attached*
A): Prepare a horizontal analysis of the net income comparing 2012 and 2013. (Round percentages to one decimal place.)
(how to answer chart is attached)
Comparative statement data for Douglas Company and Maulder Company, two com-petitors, appear below. All balance sheet data are as of December 31, 2011, and December 31,2010.Douglas Company Maulder Company2011 2010 2011 2010Net sales $1,549,035 $339,038Cost of goods sold 1,080,490 241,000Operating expenses 302,275 79,000Interest expense 8,980 2,252Income tax expense 54,500 6,650Current assets 325,975 $312,410 83,336 $ 79,467Plant assets (net) 521,310 500,000 139,728 125,812Current liabilities 65,325 75,815 35,348 30,281Long-term liabilities 108,500 90,000 29,620 25,000Common stock, $10 par 500,000 500,000 120,000 120,000Retained earnings 173,460 146,595 38,096 29,998Instructions(a) Prepare a vertical analysis of the 2011 income statement data for Douglas Company andMaulder Company in columnar form.(b) Comment on the relative profitability of the companies by computing the returnon assets and the return on common stockholders’ equity ratios for both companies.
Instruction: (Vertical Analysis) Present an interpretation and conclusions about the result of "Riel Corporation Comparative Income Statements For the years Ended December 31, 2015 & 2014" computations and analysis.
*refer to the pic*
Chapter 16 Solutions
Principles of Accounting
Knowledge Booster


Learn more about
Need a deep-dive on the concept behind this application? Look no further. Learn more about this topic, accounting and related others by exploring similar questions and additional content below.Similar questions
- Comparing Two Companies in the Same Industry: Chipotle and Panera Bread This case should be completed after responding to the requirements in Decision Case 13-2. Refer to the financial statement information of Chipotle and Panera Bread reprinted at the back of the book. Required Using the format in Example 13-5, prepare common-size comparative income statements for 2014 and 2013, for Panera Bread. Use total revenues as the base (i.e., 100%). Round all percentages to the nearest one-tenth of a percent. The common-size comparative income statements indicate the relative importance of items on the statement. Compare the common-size income statements of Panera Bread and Chipotle. What are the most important differences between the two companies income statements? Using the format in Example 13-4, prepare common-size comparative balance sheets at the end of 2014 and 2013, for Panera Bread. Round all percentages to the nearest one-tenth of a percent. The common-size comparative balance sheets indicate the relative importance of items on the statement. Compare the common-size balance sheets of Panera Bread and Chipotle. What are the most important differences between the two companies balance sheets?arrow_forwardSuppose the following historical data is from the consolidated income statements filed by a media corporation. *attached chart* B: Prepare a vertical analysis of the costs and expenses for 2013. (Round percentages to one decimal place.) *chart attached*arrow_forwardSuppose the following historical data is from the consolidated income statements filed by a media corporation. *chart attached* A: Prepare a horizontal analysis of the net income comparing 2012 and 2013. (Round percentages to one decimal place.) *Chart attached*arrow_forward
- The comparative statements of Corbin Company are presented below. CORBIN COMPANYIncome StatementFor the Years Ended December 31 2017 2016 Net sales (all on account) $600,500 $520,200 Expenses Cost of goods sold 414,600 354,200 Selling and administrative 119,900 113,300 Interest expense 8,200 5,100 Income tax expense 17,100 14,700 Total expenses 559,800 487,300 Net income $ 40,700 $ 32,900 CORBIN COMPANYBalance SheetsDecember 31 Assets 2017 2016 Current assets Cash $ 21,100 $ 17,600 Short-term investments 17,100 15,200 Accounts receivable (net) 86,100 73,000 Inventory 89,400 70,100 Total current assets 213,700 175,900 Plant assets (net) 423,800 383,200 Total assets $637,500 $559,100 Liabilities and Stockholders’ Equity…arrow_forwardAccess the February 21, 2017, filing of the December 31, 2016, 10-K report of The Hershey Company (ticker: HSY) at SEC.gov and complete the following requirements. Required Compute or identify the following profitability ratios of Hershey for its years ending December 31, 2016, and December 31, 2015. Interpret its profitability using the results obtained for these two years. 1. Profit margin ratio (round the percent to one decimal). 2. Gross profit ratio (round the percent to one decimal). 3. Return on total assets (round the percent to one decimal). (Total assets at year-end 2014 were $5,622,870 in thousands.) 4. Return on common stockholders’ equity (round the percent to one decimal). (Total shareholders’ equity at year-end 2014 was $1,519,530 in thousands.) 5. Basic net income per common share (round to the nearest cent).arrow_forwardThe financial statements for Tyler Toys, Inc. are shown in the popup window: LOADING... . Calculate the profit margin, return on assets, and return on equity for 2013 and 2014 for Tyler Toys. Should any of these ratios or the change in a ratio warrant concern for the managers of Tyler Toys or the shareholders? Tyler Toys, Inc. Income Statement for Years Ending December 31, 2013 and 2014 2014 2013 Revenue $14,147,690 $13,566,481 Cost of goods sold $-8,447,054 $-8,131,319 Selling, general, and administrative expenses $-998,405 $-981,658 Depreciation $-1,498,619 $-1,472,478 EBIT $3,203,612 $2,981,026 Interest expense $-376,184 $-355,975 Taxes $-1,074,423 $-997,519 Net income $1,753,005 $1,627,532 Right-click on the table and select Copy to Clipboard and then right-click the highlighted texts in the popup dialogue box and select Copy in order to paste its…arrow_forward
- The financial statements for Tyler Toys, Inc. are shown in the popup window: LOADING... . Calculate the profit margin, return on assets, and return on equity for 2013 and 2014 for Tyler Toys. Should any of these ratios or the change in a ratio warrant concern for the managers of Tyler Toys or the shareholders? Tyler Toys, Inc. Income Statement for Years Ending December 31, 2013 and 2014 2014 2013 Revenue $14,146,094 $13,567,551 Cost of goods sold $-8,448,688 $-8,131,338 Selling, general, and administrative expenses $-998,878 $-980,620 Depreciation $-1,497,580 $-1,472,740 EBIT $3,200,948 $2,982,853 Interest expense $-376,634 $-354,060 Taxes $-1,073,239 $-998,941 Net income $1,751,075 $1,629,852 Right-click on the table and select Copy to Clipboard and then right-click the highlighted texts in the popup dialogue box and select Copy in order to paste its…arrow_forwardFollowing are income statements for Hossa Corporation for 2017 and 2016. Percentage of sales amounts are also shown for each operating expense item. Hossa’s income tax rate was 38% in 2016 and 40% in 2017. How do you calculate the cause of change analysis past sales?arrow_forwardAnalytical case—complete an income statement and balance sheet usingfinancial ratio data Partially completed financial statements for Whittaker, Inc., follow: WHITTAKER, INC.Income StatementFor the Year Ended December 31, 2014Sales . . . . . . . . . . . . . . . . . . . . . . . . . . . . . . . . . . . . . . . . . . . . . . . . . . . . . . . . . . . . . . . $ ?Cost of goods sold . . . . . . . . . . . . . . . . . . . . . . . . . . . . . . . . . . . . . . . . . . . . . . . . . . . . ?Gross profi t . . . . . . . . . . . . . . . . . . . . . . . . . . . . . . . . . . . . . . . . . . . . . . . . . . . . . . . . . . $ ?Operating expenses . . . . . . . . . . . . . . . . . . . . . . . . . . . . . . . . . . . . . . . . . . . . . . . . . . . ?Income from operations. . . . . . . . . . . . . . . . . . . . . . . . . . . . . . . . . . . . . . . . . . . . . . . . . $ ?Interest expense . . . . . . . . . . . . . . . . . . . . . . . . . . . . . . . . . . . . . . . . . . . . . . . . . . . . . . ?Income…arrow_forward
- Please answer the question below according to the information given in the attachment: a) Using the information provided for 31 Dec 2005, calculate the following: net working capital, current ratio, quick ratio, inventory turnover, average collection period, total debt ratio, gross profit margin, net profit margin, return on total assets, return on equity. b) Evaluate the company’s performance against industry average ratios and compare with last year’s results.arrow_forwardComparative income statement for Deep Sea Company for 2016 and 2015 are given below: Prepare the common size income statement of Deep Sea Company for 2016 and 2015. Enter the numbers without decimals. Do not round off the numbers. Add % sign after the numbers. Revenue unanswered unanswered Cost Of goods sold unanswered unanswered Gross profit unanswered unanswered Selling and general expenses unanswered unanswered Operating profit unanswered unanswered Interest expense unanswered unanswered Income before tax unanswered unanswered Income tax expenses unanswered unanswered Net Profit unanswered unansweredarrow_forwardThe following information was extracted from the books of ABC ltd for the years ended December 2014 and 2013: Trading, Profit and Loss Account (Income statement ) 2014 Ksh. 2013 Ksh. Sales Cost of sales Gross profit Operating expenses Profit before taxation Current year’s taxation Profit after taxation Dividends Retained profit for the year 31,000,000 18,000,000 13,000,000 9,500,000 3,500,000 1,600,000 1,900,000 600,000 1,300,000 25,500,000 16,000,000 9,500,000 7,500,000 2,000,000 900,000 1,100,000 600,000 500,000 Balance Sheets (Statements of financial Position) | Kshs. 2014 Kshs.’ 2013 Fixed assets (net book value) Freehold land and factory building Plant and equipment Motor vehicles Current assets: Stock Debtors Cash and bank balance Current liabilities: Creditors…arrow_forward
arrow_back_ios
SEE MORE QUESTIONS
arrow_forward_ios
Recommended textbooks for you
 Financial Accounting: The Impact on Decision Make...AccountingISBN:9781305654174Author:Gary A. Porter, Curtis L. NortonPublisher:Cengage Learning
 Principles of Accounting Volume 1AccountingISBN:9781947172685Author:OpenStaxPublisher:OpenStax College
 Cornerstones of Financial AccountingAccountingISBN:9781337690881Author:Jay Rich, Jeff JonesPublisher:Cengage Learning
 Survey of Accounting (Accounting I)AccountingISBN:9781305961883Author:Carl WarrenPublisher:Cengage Learning
 Excel Applications for Accounting PrinciplesAccountingISBN:9781111581565Author:Gaylord N. SmithPublisher:Cengage Learning
Financial Accounting: The Impact on Decision Make...
Accounting
ISBN:9781305654174
Author:Gary A. Porter, Curtis L. Norton
Publisher:Cengage Learning
Principles of Accounting Volume 1
Accounting
ISBN:9781947172685
Author:OpenStax
Publisher:OpenStax College
Cornerstones of Financial Accounting
Accounting
ISBN:9781337690881
Author:Jay Rich, Jeff Jones
Publisher:Cengage Learning
Survey of Accounting (Accounting I)
Accounting
ISBN:9781305961883
Author:Carl Warren
Publisher:Cengage Learning
Excel Applications for Accounting Principles
Accounting
ISBN:9781111581565
Author:Gaylord N. Smith
Publisher:Cengage Learning
The KEY to Understanding Financial Statements; Author: Accounting Stuff;https://www.youtube.com/watch?v=_F6a0ddbjtI;License: Standard Youtube License