
Concept explainers
Videos
The figure depicts the sequence of events in each cylinder of a four-cylinder internal combustion engine. Each piston moves up and down and is connected by a pivoted arm to a rotating crankshaft. Let P(t) and V(t) be the pressure and volume within a cylinder at time t, where a ≤ t ≤ b gives the time required for a complete cycle. The graph shows how P and V vary through one cycle of a four-stroke engine.
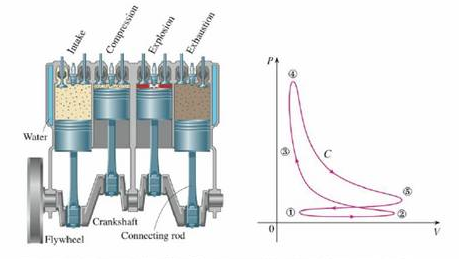
During the intake stroke (from ① to ②) a mixture of air and gasoline at atmospheric pressure is drawn into a cylinder through the intake valve as the piston moves downward. Then the piston rapidly compresses the mix with the valves closed in the compression stroke (from ② to ③) during which the pressure rises and the volume decreases. At ③ the sparkplug ignites the fuel, raising the temperature and pressure at almost constant volume to ④. Then, with valves closed, the rapid expansion forces the piston downward during the power stroke (from ④ to ⑤). The exhaust valve opens, temperature and pressure drop, and mechanical energy stored in a rotating flywheel pushes the piston upward, forcing the waste products out of the exhaust valve in the exhaust stroke. The exhaust valve closes and the intake valve opens. We’re now back at ① and the cycle starts again.
(a) Show that the work done on the piston during one cycle of a four-stroke engine is W = ∫C P dV, where C is the curve in the PV-plane shown in the figure. [Hint: Let x(t) be the distance from the piston to the top of the cylinder and note that the force on the piston is F = AP(t) i, where A is the area of the top of the piston. Then W = ∫
(b) Use Formula 16.4.5 to show that the work is the difference of the areas enclosed by the two loops of C.

Trending nowThis is a popular solution!

Chapter 16 Solutions
Multivariable Calculus


- Repeat Example 5 when microphone A receives the sound 4 seconds before microphone B.arrow_forwardThe population Pinmillions of Texas from 2001 through 2014 can be approximated by the model P=20.913e0.0184t, where t represents the year, with t=1 corresponding to 2001. According to this model, when will the population reach 32 million?arrow_forwardThe population P (in millions) of Texas from 2001 through 2014 can be approximated by the model P=20.913e0.0184t, where t represents the year, with t=1 corresponding to 2001. According to this model, when will the population reach 32 million?arrow_forward
 Algebra & Trigonometry with Analytic GeometryAlgebraISBN:9781133382119Author:SwokowskiPublisher:Cengage
 Trigonometry (MindTap Course List)TrigonometryISBN:9781337278461Author:Ron LarsonPublisher:Cengage Learning