
Modern Business Statistics with Microsoft Office Excel (with XLSTAT Education Edition Printed Access Card) (MindTap Course List)
6th Edition
ISBN: 9781337115186
Author: David R. Anderson, Dennis J. Sweeney, Thomas A. Williams, Jeffrey D. Camm, James J. Cochran
Publisher: Cengage Learning
expand_more
expand_more
format_list_bulleted
Concept explainers
Videos
Textbook Question
Chapter 16.1, Problem 1E
Consider the following data for two variables, x and y.
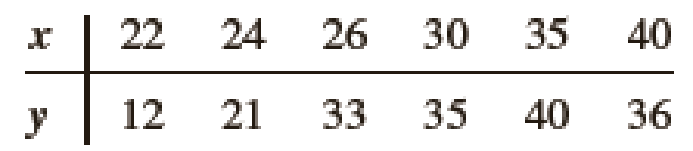
- a. Develop an estimated regression equation for the data of the form
- b. Using the results from part (a), test for a significant relationship between x and y; use α = .05.
- c. Develop a
scatter diagram for the data. Does the scatter diagram suggest an estimated regression equation of the form - d. Develop an estimated regression equation for the data of the form
- e. Refer to part (d). Is the relationship between x, x2, and y significant? Use α = .05.
- f. Predict the value of y when x = 25.
Expert Solution & Answer
Want to see the full answer?
Check out a sample textbook solution
Students have asked these similar questions
You spilled water on your calculations from (a) and can't remember what your estimated regression parameters are. But you do have two possible estimated errors for each of your initial four observations:
The table below gives the number of hours seven randomly selected students spent studying and their corresponding midterm exam grades. Using this data, consider the equation of the regression line, yˆ=b0+b1x�^=�0+�1�, for predicting the midterm exam grade that a student will earn based on the number of hours spent studying. Keep in mind, the correlation coefficient may or may not be statistically significant for the data given. Remember, in practice, it would not be appropriate to use the regression line to make a prediction if the correlation coefficient is not statistically significant.
Hours Studying
1
2
3
3.5
4
4.5
5
Midterm Grades
60
66
73
76
78
84
90
Table
Copy Data
Step 1 of 6:
Find the estimated slope. Round your answer to three decimal places.
The table below gives the number of hours seven randomly selected students spent studying and their corresponding midterm exam grades. Using this data, consider the equation of the regression line, yˆ=b0+b1x�^=�0+�1�, for predicting the midterm exam grade that a student will earn based on the number of hours spent studying. Keep in mind, the correlation coefficient may or may not be statistically significant for the data given. Remember, in practice, it would not be appropriate to use the regression line to make a prediction if the correlation coefficient is not statistically significant.
Hours Studying
11
1.51.5
2.52.5
33
44
4.54.5
55
Midterm Grades
6666
6969
7575
7979
9090
9595
9898
Find the estimated slope. Round your answer to three decimal places.
Find the estimated y-intercept. Round your answer to three decimal places.
Determine if the statement "Not all points predicted by the linear model fall on the same line" is true or false.…
Chapter 16 Solutions
Modern Business Statistics with Microsoft Office Excel (with XLSTAT Education Edition Printed Access Card) (MindTap Course List)
Ch. 16.1 - Consider the following data for two variables, x...Ch. 16.1 - Consider the following data for two variables, x...Ch. 16.1 - Prob. 3ECh. 16.1 - A highway department is studying the relationship...Ch. 16.1 - In working further with the problem of exercise 4,...Ch. 16.1 - A study of emergency service facilities...Ch. 16.1 - Home Depot, a nationwide home improvement...Ch. 16.1 - Corvette, Ferrari, and Jaguar produced a variety...Ch. 16.1 - The film Suicide Squad has an average rating of...Ch. 16.2 - In a regression analysis involving 27...
Ch. 16.2 - Prob. 11ECh. 16.2 - The Professional Golfers’ Association of America...Ch. 16.2 - Refer to exercise 12.
Develop an estimated...Ch. 16.2 - A 10-year study conducted by the American Heart...Ch. 16.2 - The average monthly residential gas bill for Black...Ch. 16.5 - Prob. 16ECh. 16.5 - Prob. 17ECh. 16.5 - Prob. 18ECh. 16.5 - Prob. 19ECh. 16.5 - Prob. 20ECh. 16.5 - Prob. 21ECh. 16.5 - Prob. 22ECh. 16.5 - Prob. 23ECh. 16.6 - The following data show the daily closing prices...Ch. 16.6 - Refer to the Cravens data set in Table 16.5. In...Ch. 16 - A sample containing years to maturity and yield...Ch. 16 - Consumer Reports tested 19 different brands and...Ch. 16 - A study investigated the relationship between...Ch. 16 - Refer to the data in exercise 28. Consider a model...Ch. 16 - Refer to the data in exercise 28.
Develop an...Ch. 16 - Prob. 31SECh. 16 - The Ladies Professional Golf Association (LPGA)...Ch. 16 - Wine Spectator magazine contains articles and...
Knowledge Booster


Learn more about
Need a deep-dive on the concept behind this application? Look no further. Learn more about this topic, statistics and related others by exploring similar questions and additional content below.Similar questions
- The table below gives the number of hours seven randomly selected students spent studying and their corresponding midterm exam grades. Using this data, consider the equation of the regression line, yˆ=b0+b1x�^=�0+�1�, for predicting the midterm exam grade that a student will earn based on the number of hours spent studying. Keep in mind, the correlation coefficient may or may not be statistically significant for the data given. Remember, in practice, it would not be appropriate to use the regression line to make a prediction if the correlation coefficient is not statistically significant. Hours Studying 1 2 3 3.5 4 4.5 5 Midterm Grades 60 66 73 76 78 84 90 Step 2 of 6: Find the estimated y-intercept. Round your answer to three decimal places. Step 3 of 6: Find the estimated value of y when x=2�=2. Round your answer to three decimal places. Step 4 of 6: Substitute the values you found in steps 1 and 2 into the equation for the regression line to find the estimated…arrow_forwardAccording to World Health Organization (WHO), the recommended limit for a noise level inside a classroom is 35 dBA. However, nine out of ten schools fail to meet this recommendation. A researcher wishes to conduct a study relevant to the prior information, but as a gap, he decides to include the area (in square meters) of every classroom and how it could possibly affect the resulting noise level. He selects 17 classrooms at random, and the noise levels are recorded in the next slide. a. Find the regression equation and construct the scatter plot diagram. b. Predict the noise level if a classroom has an area of 85.97 m2 . c. Calculate the coefficient of determination and interpret the findings. d. Calculate the coefficient of alienation and interpret the findings. Use Excelarrow_forwardFor 40 eruptions of the Old Faithful geyser in Yellowstone National Park, duration times (sec) were recorded along with the heights (ft) of the eruptions. The linear correlation coefficient is r = 0.0915 and the regression equation is = 119 + 0.0331x, where x represents duration time. The mean of the 40 duration times is 245.0 sec and the mean of the 40 heights is 127.2 ft. What is the best predicted height of an eruption with a duration time of 120 min?arrow_forward
- ** had to resubmit this question because the first time the data was duplicated and reflected incorrectly. The table below gives the number of hours spent unsupervised each day as well as the overall grade averages for seven randomly selected middle school students. Using this data, consider the equation of the regression line, yˆ=b0+b1xy^=b0+b1x, for predicting the overall grade average for a middle school student based on the number of hours spent unsupervised each day. Keep in mind, the correlation coefficient may or may not be statistically significant for the data given. Remember, in practice, it would not be appropriate to use the regression line to make a prediction if the correlation coefficient is not statistically significant. Hours Unsupervised 1 2 3 4 5 5.5 6 Overall Grades 96 89 87 77 76 68 64 **Please circle the answer for each step so I don't get confused. Thanks in advance for helping me with the breakdown and notes** Step 1 of 6 : Find the…arrow_forwardA researcher examined the relationship between the annual tax amount paid by the construction company owners and the total expense items spent for the construction with regression analysis and calculated the regression line estimation as Y=6+2X. According to this; Write the interpretations of the cutoff and regression parameters, respectively, in your OWN SENTENCES in a statistically appropriate way over the tax amount and expenses.arrow_forwardThe table below gives the number of hours ten randomly selected students spent studying and their corresponding midterm exam grades. Using this data, consider the equation of the regression line, yˆ=b0+b1x, for predicting the midterm exam grade that a student will earn based on the number of hours spent studying. Keep in mind, the correlation coefficient may or may not be statistically significant for the data given. Remember, in practice, it would not be appropriate to use the regression line to make a prediction if the correlation coefficient is not statistically significant. Hours Studying 0 0.5 1.5 2 2.5 3 4.5 5 5.5 6 Midterms Grades 60 63 64 69 73 76 82 90 91 95 Step 1 of 6: Find the estimated slope. Round your answer to three decimal places. Step 2 of 6: Find the estimated y-intercept. Round your answer to three decimal places. Step 3 of 6: Determine if the statement "All points predicted by the linear model fall on the same line" is true or false Step 4 of 6:…arrow_forward
- The table below gives the number of hours ten randomly selected students spent studying and their corresponding midterm exam grades. Using this data, consider the equation of the regression line, y^=b0+b1x, for predicting the midterm exam grade that a student will earn based on the number of hours spent studying. Keep in mind, the correlation coefficient may or may not be statistically significant for the data given. Remember, in practice, it would not be appropriate to use the regression line to make a prediction if the correlation coefficient is not statistically significant. Hours Studying 0 1 2 2.5 3 3.5 4 4.5 5.5 6 Midterm Grades 61 64 65 66 71 79 84 88 94 98 Summation Table x y xy x2 y2 Student 1 0.0 61 0.0 0.00 3721 Student 2 1.0 64 64.0 1.00 4096 Student 3 2.0 65 130.0 4.00 4225 Student 4 2.5 66 165.0 6.25 4356 Student 5 3.0 71 213.0 9.00 5041 Student 6 3.5 79 276.5 12.25 6241 Student 7 4.0 84 336.0 16.00 7056 Student 8 4.5 88 396.0 20.25 7744…arrow_forwardThe following results are from data concerning the amount withdrawn from an ATM machine based on the amount of time spent at the ATM machine (SECONDS) and the gender, FEMALE (dummy variable = 1 for females and = 0 for males) and an interaction term, SECONDS*FEMALE Based on the regression results, what is the predicted amount withdrawn for a male who spends 20 at the ATM machine? (please express your answer using 1 decimal places)arrow_forwardThe table below gives the number of hours five randomly selected students spent studying and their corresponding midterm exam grades. Using this data, consider the equation of the regression line, y^=b0+b1x, for predicting the midterm exam grade that a student will earn based on the number of hours spent studying. Keep in mind, the correlation coefficient may or may not be statistically significant for the data given. Remember, in practice, it would not be appropriate to use the regression line to make a prediction if the correlation coefficient is not statistically significant. Hours Studying 1 2 4 5 6 Midterm Grades 67 68 70 79 87 Summation Table x y xy x2 y2 Student 1 1 67 67 1 4489 Student 2 2 68 136 4 4624 Student 3 4 70 280 16 4900 Student 4 5 79 395 25 6241 Student 5 6 87 522 36 7569 Sum 18 371 1400 82 27823 Step 1 of 6: Find the estimated slope. Round your answer to three decimal places. Step 2 of 6: Find the estimated y-intercept. Round your…arrow_forward
- The table below gives the number of hours five randomly selected students spent studying and their corresponding midterm exam grades. Using this data, consider the equation of the regression line, yˆ=b0+b1xy^=b0+b1x, for predicting the midterm exam grade that a student will earn based on the number of hours spent studying. Keep in mind, the correlation coefficient may or may not be statistically significant for the data given. Remember, in practice, it would not be appropriate to use the regression line to make a prediction if the correlation coefficient is not statistically significant. Hours of studying 0 1 2 4 5 Midterm Grades 67 77 83 97 99 Find the estiamted slope. round answer 3 decimal placesarrow_forwardThe table below gives the number of hours five randomly selected students spent studying and their corresponding midterm exam grades. Using this data, consider the equation of the regression line, yˆ=b0+b1xy^=b0+b1x, for predicting the midterm exam grade that a student will earn based on the number of hours spent studying. Keep in mind, the correlation coefficient may or may not be statistically significant for the data given. Remember, in practice, it would not be appropriate to use the regression line to make a prediction if the correlation coefficient is not statistically significant. Hours Studying 0 1 2 4 5 Midterm grades 67 77 83 97 99 find the y intercept and round to three decimal placesarrow_forwardThe table below gives the number of hours five randomly selected students spent studying and their corresponding midterm exam grades. Using this data, consider the equation of the regression line, yˆ=b0+b1xy^=b0+b1x, for predicting the midterm exam grade that a student will earn based on the number of hours spent studying. Keep in mind, the correlation coefficient may or may not be statistically significant for the data given. Remember, in practice, it would not be appropriate to use the regression line to make a prediction if the correlation coefficient is not statistically significant. hours studying 0 1 3 4 5 grades 63 65 80 81 87 Calculate the correlation coefficient, r. Round your answer to three decimal places.arrow_forward
arrow_back_ios
SEE MORE QUESTIONS
arrow_forward_ios
Recommended textbooks for you
 MATLAB: An Introduction with ApplicationsStatisticsISBN:9781119256830Author:Amos GilatPublisher:John Wiley & Sons Inc
 Probability and Statistics for Engineering and th...StatisticsISBN:9781305251809Author:Jay L. DevorePublisher:Cengage Learning
 Statistics for The Behavioral Sciences (MindTap C...StatisticsISBN:9781305504912Author:Frederick J Gravetter, Larry B. WallnauPublisher:Cengage Learning
 Elementary Statistics: Picturing the World (7th E...StatisticsISBN:9780134683416Author:Ron Larson, Betsy FarberPublisher:PEARSON
 The Basic Practice of StatisticsStatisticsISBN:9781319042578Author:David S. Moore, William I. Notz, Michael A. FlignerPublisher:W. H. Freeman
 Introduction to the Practice of StatisticsStatisticsISBN:9781319013387Author:David S. Moore, George P. McCabe, Bruce A. CraigPublisher:W. H. Freeman
MATLAB: An Introduction with Applications
Statistics
ISBN:9781119256830
Author:Amos Gilat
Publisher:John Wiley & Sons Inc
Probability and Statistics for Engineering and th...
Statistics
ISBN:9781305251809
Author:Jay L. Devore
Publisher:Cengage Learning
Statistics for The Behavioral Sciences (MindTap C...
Statistics
ISBN:9781305504912
Author:Frederick J Gravetter, Larry B. Wallnau
Publisher:Cengage Learning
Elementary Statistics: Picturing the World (7th E...
Statistics
ISBN:9780134683416
Author:Ron Larson, Betsy Farber
Publisher:PEARSON
The Basic Practice of Statistics
Statistics
ISBN:9781319042578
Author:David S. Moore, William I. Notz, Michael A. Fligner
Publisher:W. H. Freeman
Introduction to the Practice of Statistics
Statistics
ISBN:9781319013387
Author:David S. Moore, George P. McCabe, Bruce A. Craig
Publisher:W. H. Freeman
Correlation Vs Regression: Difference Between them with definition & Comparison Chart; Author: Key Differences;https://www.youtube.com/watch?v=Ou2QGSJVd0U;License: Standard YouTube License, CC-BY
Correlation and Regression: Concepts with Illustrative examples; Author: LEARN & APPLY : Lean and Six Sigma;https://www.youtube.com/watch?v=xTpHD5WLuoA;License: Standard YouTube License, CC-BY