
Introduction To Statistics And Data Analysis
6th Edition
ISBN: 9781337793612
Author: PECK, Roxy.
Publisher: Cengage Learning,
expand_more
expand_more
format_list_bulleted
Videos
Textbook Question
Chapter 16.2, Problem 10E
In an experiment to study the way in which different anesthetics affected plasma epinephrine concentration, 10 dogs were selected and concentration was measured while they were under the influence of the anesthetics isoflurane and halothane (“Sympathoadrenal and Hemodynamic Effects of Isoflurane, Halothane, and Cyclopropane in Dogs” Anesthesiology [1974]: 465–470). The resulting data are as follows:
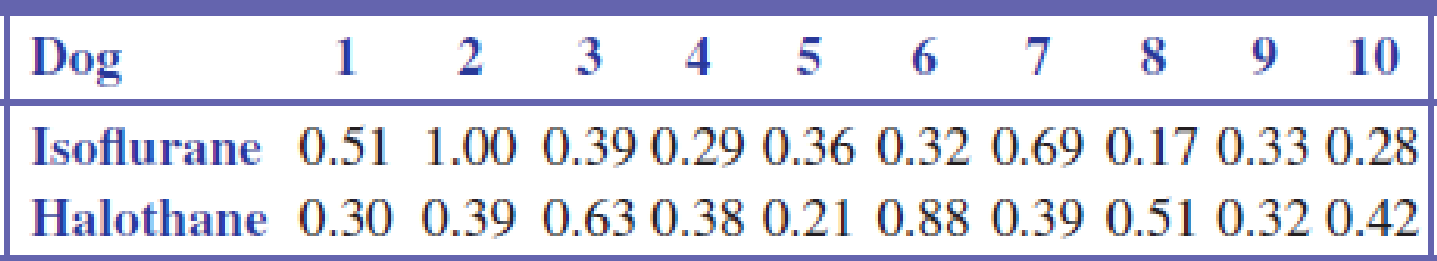
Use a level 0.05 signed-rank test to determine whether the mean epinephrine concentration differs for the two anesthetics. What assumption must be made about the epinephrine concentration distributions?
Expert Solution & Answer
Want to see the full answer?
Check out a sample textbook solution
Students have asked these similar questions
The article “Differences in Susceptibilities of Different Cell Lines to Bilirubin Damage” (K. Ngai, C. Yeung, and C. Leung, Journal of Paediatric Child Health, 2000:36–45) reports an investigation into the toxicity of bilirubin on several cell lines. Ten sets of human liver cells and 10 sets of mouse fibroblast cells were placed into solutions of bilirubin in albumin with a 1.4 bilirubin/albumin molar ratio for 24 hours. In the 10 sets of human liver cells, the average percentage of cells surviving was 53.9 with a standard deviation of 10.7. In the 10 sets of mouse fibroblast cells, the average percentage of cells surviving was 73.1 with a standard deviation of 9.1. Find a 98% confidence interval for the difference in survival percentages between the two cell lines.
In a study conducted in the Science Department of Faculty of Science, Technology and Human Development in a University; the researcher examined the influence of the drug succinylcholine on the circulation levels of androgens in the blood. Blood samples from wild, free-ranging deer were obtained via the jugular vein immediately after an intramuscular injection of succinylcholine using darts and a capture gun. Deer were bled again approximately 30 minutes after the injection and then released. The level of androgens at time of capture and 30 minutes later, measured in nanograms per milliliter (ng/ml), for 15 deers as in Table Q1.
Assuming that the populations of androgen at time of injection and 30 minutes later are normally distributed:i) Find the average and standard deviation of this studyii)Determine the critical region of this problem.iii) Test at the 0.05 level of significance whether the androgen concentrations are altered after 30 minutes of restraint.
Suppose a researcher is interested inthe effectiveness in a new childhood exercise program implemented in a SRS of schools across a particular county. In order to test the hypothesis that the new program decreases BMI (Kg/m2), the researcher takes a SRS of children from schools where the program is employed and a SRS from schools that do not employ the program and compares the results. Assume the following table represents the SRSs of students and their BMIs.
Student intervention group
BMI (kg/m2)
Student control group
BMI (kg/m2)
A
18.6
A
21.6
B
18.2
B
18.9
C
19.5
C
19.4
D
18.9
D
22.6
E
24.1
F
23.6
A) Assuming that all the necessary conditions are met (normality, independence, etc.) carry out the appropriate statistical test to determine if the new exercise program is effective. Use an alpha level of 0.05. Do not assume equal variances.B) Construct a 95% confidence interval about your estimate for the average difference in BMI between the groups.
Chapter 16 Solutions
Introduction To Statistics And Data Analysis
Ch. 16.1 - Urinary fluoride concentration (in parts per...Ch. 16.1 - Prob. 2ECh. 16.1 - Prob. 3ECh. 16.1 - A blood lead level of 70 mg/ml has been commonly...Ch. 16.1 - The effectiveness of antidepressants in treating...Ch. 16.1 - Prob. 6ECh. 16.1 - Prob. 7ECh. 16.2 - The effect of a restricted diet in the treatment...Ch. 16.2 - Peak force (N) on the hand was measured just prior...Ch. 16.2 - In an experiment to study the way in which...
Ch. 16.2 - Prob. 11ECh. 16.2 - Prob. 12ECh. 16.2 - Prob. 13ECh. 16.2 - Prob. 14ECh. 16.2 - Prob. 15ECh. 16.2 - Prob. 16ECh. 16.2 - Prob. 17ECh. 16.2 - The signed-rank test can be adapted for use in...Ch. 16.3 - Prob. 19ECh. 16.3 - Prob. 20ECh. 16.3 - The given data on phosphorus concentration in...Ch. 16.3 - Prob. 22ECh. 16.3 - Prob. 23ECh. 16.3 - The following data on amount of food consumed (g)...Ch. 16.3 - The article Effect of Storage Temperature on the...
Knowledge Booster


Learn more about
Need a deep-dive on the concept behind this application? Look no further. Learn more about this topic, statistics and related others by exploring similar questions and additional content below.Similar questions
- The Lion’sMane. In a study by P. M.West titled “The Lion’s Mane” (American Scientist, Vol. 93, No. 3, pp. 226–236), the effects of the mane of a male lion as a signal of quality to mates and rivals was explored. Four life-sized dummies of male lions provided a tool for testing female response to the unfamiliar lions whose manes varied by length (long or short) and color (blonde or dark). The female lions were observed to see whether they approached each of the four life-sized dummies. a. experimental units. b. response variable. c. factor(s). d. levels of each factor. e. treatments.arrow_forwardA sample of men and women who had passed their driver's test either the first time or the second time were surveyed, with the following results: Results of the driving testGender First time Second timeMen 126 211Women 135 178a) Do these data suggest that there is a relationship between gender and the passing of their driver’s test from which the present sample was drawn? Let alpha=.05arrow_forwardclassify as either observational or experimental design Heart Failure. In the paper “Cardiac-Resynchronization Therapy with or without an Implantable Defibrillator in Advanced Chronic Heart Failure” (New England Journal of Medicine, Vol. 350, pp. 2140–2150), M. Bristow et al. reported the results of a study of methods for treating patients who had advanced heart failure due to ischemic or nonischemic cardiomyopathies. A total of 1520 patientswere randomly assigned in a 1:2:2 ratio to receive optimal pharmacologic therapy alone or in combination with either a pacemaker or a pacemaker–defibrillator combination. The patients were thenobserved until they died or were hospitalized for any cause.arrow_forward
- In this study, ten combat veterans undergoing treatment for PTSD were randomly sampled from a local VA hospital in a study designed to test the efficacy of an anti-anxiety medication in reducing the symptoms of PTSD. Based on clinical animal trials, the researchers predict that the drug should reduce symptoms. t= 1.63, df=9, p=0.064, d= 0.529. Before: M= 48.100, SD=1.370, SE=0.433 After: M= 47.000, SD= 1.491, SE= 0.471 My hypotheses are; H0: μbefore ≤ μafter. H1: μbefore > μafter A. State your findings in APA format: B. How would you explain these findings to someone who has never taken a statistics class? In other words, use clear direct, non-jargon language to explain the results:arrow_forwardPeanut Allergies. In the article “Food Allergy Advice May Be Peanuts” (Science News, Vol. 174, No. 12, pp. 8–9), N. Seppa reports that early exposure to peanuts seems to lessen the risk of nut allergy. Of 4000 Jewish children sampled in Britain, 1.85% had peanut allergies; and of 4600 Jewish children sampled in Israel, where early peanut consumption is more common, 0.17% had peanut allergies. The researcher chose Jewish children in both countries to limit genetic differences between groups. a. Is this study descriptive or inferential? b. Is this study observational or experimental?arrow_forwardA doctor would like to evaluate whether flu-frequency is different among patients of various ages. He groups his most recent 12 patients into four groups according to age (pediatric, young adult, older adult, senior), and counts the frequency of their flu-related visits. Below is his data. Test the hypothesis that flu frequency is different among pediatric, adult, older adult, and senior patients using an alpha level of .01. Pediatric. Young Adult. Older Adult. Senior 6 2 4 7 4 1 0 9 5 0 0 12 g. What does your decision mean? h. Paste your SPSS output here: i. Explain how the Sig. value in your SPSS output leads you to…arrow_forward
- In recent years, concerns have been expressed about adverse health effects from amalgam dental restorations, which include mercury. The table below shows results from a study in which some patients were treated with amalgam restorations and others were treated with composite restorations that do not contain mercury (based on data from “Neuropsychological and Renal Effects of Dental Amalgam in Children,” by Bellinger, et al., Journal of the American Medical Association, Vol. 295, No. 15). Use a 0.05 significance level to test for independence between the type of restoration and sensory disorders. Do amalgam restorations appear to affect sensory disorders? Amalgam Composite Sensory disorder 36 28 No sensory disorder 231 239arrow_forwardA physiologist has conducted an experiment to evaluate the effect of hormone X on sexual behavior. Ten rats were injected with hormone X and 10 other rats received a placebo injection. The number of matings was counted over a 20-minute period. The results are shown in the table below. Table 1: Data from hormone X experiment Group 1 Hormone X Group 2 Placebo X1 (X1) 2 X2 (X1) 2 8 64 5 25 10 100 6 36 12 144 3 9 6 36 4 16 6 36 7 49 7 49 8 64 9 81 6 36 8 64 5 25 7 49 4 16 11 121 8 64 84 744 56 340 a) What is the alternative hypothesis? Use a nondirectional hypothesis. b) What is the null hypothesis? c) What do you conclude? Use α = 0.05 (2-tail)arrow_forwardBaum and Gatchel (1981, Cognitive determinants of reaction to uncontrollable events: Development of reactance andlearned helplessness. Journal of Personality and Social Psychology, 40, 1078-1089) found that students living in longcorridordorms (housing 30 to 40 residents per corridor) had greater feelings of helplessness than those living in shortcorridordorms (housing less than 20 residents per corridor). A resident director at GSU wished to test this finding tolearn whether corridor length impacted students' sense of alienation. She randomly assigned 20 students to live in aresidence hall, with 10 students in long and 10 students in short corridors for the year. At the end of the year, each2/16/21 3student completed a measure of alienation. Below are her data—does corridor length affect feelings of alienation? Use an independent samples t-test to analyze these data. Corridor LengthAlienation Scores From 20 Different StudentsLong =19,15,14,15,15,9,16,15,17,13Short =11,…arrow_forward
- In a study of hypnotic suggestion, 16 male volunteers were randomly allocated to a treatment groupand a control group. Each subject participated in a two-phase experimental session. In the first phase, respiration was measured while the subject was awake and at rest. In the second phase, the subject was told to imagine that he was performing muscular work, and respiration was measured again. For subjects in the treatment group, hypnosis was induced between the first and second phases; thus, the suggestion to imagine muscular work was “hypnotic suggestion” for treatment subjects and “waking suggestion” for control subjects. The table below shows the measurements of total ventilation (liters of air per minute per square meter of body area) for all 16 subjects. (a) For those being hypnotized (treatment group), test the hypotheses H0: μrest = μwork versus Ha:μrest 6= μwork, where μrest and μwork are respectively the mean total ventilation when they are atrest and when they are performing…arrow_forwardIn its January 25, 2012, issue, the Journal of the American Medical Association reported on the effects of overconsumption of low, normal, and high protein diets on weight gain, energy expenditure, and body composition. Researchers conducted a single blind, randomized controlled trial of 25 U.S. adults. The subjects were healthy, weight-stable, male and female volunteers, aged 18 to 35 years. All subjects consumed a weight-stabilizing diet for 13 to 25 days. Afterwards, the researchers randomly assigned participants to diets containing various percentages of energy from protein: 5% (low protein), 15% (normal protein), or 25% (high protein). The subjects were not aware of the specific protein level diet to which they were assigned. On these diets the researchers overfed the participants during the last 8 weeks of their 10 to 12 week stay in the inpatient metabolic unit. The goal was to investigate the effect of overconsumption of protein on weight gain, energy expenditure, and body…arrow_forwardA doctor would like to evaluate whether flu-frequency is different among patients of various ages. He groups his most recent 12 patients into four groups according to age (pediatric, young adult, older adult, senior), and counts the frequency of their flu-related visits. Below is his data. Test the hypothesis that flu frequency is different among pediatric, adult, older adult, and senior patients using an alpha level of .01. Pediatric. Young Adult. Older Adult. Senior 6 2 4 7 4 1 0 9 5 0 0 12 a. What test is appropriate? b. State your null hypothesis: c. State your alternative hypothesis. d. Find the critical value:…arrow_forward
arrow_back_ios
SEE MORE QUESTIONS
arrow_forward_ios
Recommended textbooks for you
 MATLAB: An Introduction with ApplicationsStatisticsISBN:9781119256830Author:Amos GilatPublisher:John Wiley & Sons Inc
 Probability and Statistics for Engineering and th...StatisticsISBN:9781305251809Author:Jay L. DevorePublisher:Cengage Learning
 Statistics for The Behavioral Sciences (MindTap C...StatisticsISBN:9781305504912Author:Frederick J Gravetter, Larry B. WallnauPublisher:Cengage Learning
 Elementary Statistics: Picturing the World (7th E...StatisticsISBN:9780134683416Author:Ron Larson, Betsy FarberPublisher:PEARSON
 The Basic Practice of StatisticsStatisticsISBN:9781319042578Author:David S. Moore, William I. Notz, Michael A. FlignerPublisher:W. H. Freeman
 Introduction to the Practice of StatisticsStatisticsISBN:9781319013387Author:David S. Moore, George P. McCabe, Bruce A. CraigPublisher:W. H. Freeman
MATLAB: An Introduction with Applications
Statistics
ISBN:9781119256830
Author:Amos Gilat
Publisher:John Wiley & Sons Inc
Probability and Statistics for Engineering and th...
Statistics
ISBN:9781305251809
Author:Jay L. Devore
Publisher:Cengage Learning
Statistics for The Behavioral Sciences (MindTap C...
Statistics
ISBN:9781305504912
Author:Frederick J Gravetter, Larry B. Wallnau
Publisher:Cengage Learning
Elementary Statistics: Picturing the World (7th E...
Statistics
ISBN:9780134683416
Author:Ron Larson, Betsy Farber
Publisher:PEARSON
The Basic Practice of Statistics
Statistics
ISBN:9781319042578
Author:David S. Moore, William I. Notz, Michael A. Fligner
Publisher:W. H. Freeman
Introduction to the Practice of Statistics
Statistics
ISBN:9781319013387
Author:David S. Moore, George P. McCabe, Bruce A. Craig
Publisher:W. H. Freeman
Hypothesis Testing using Confidence Interval Approach; Author: BUM2413 Applied Statistics UMP;https://www.youtube.com/watch?v=Hq1l3e9pLyY;License: Standard YouTube License, CC-BY
Hypothesis Testing - Difference of Two Means - Student's -Distribution & Normal Distribution; Author: The Organic Chemistry Tutor;https://www.youtube.com/watch?v=UcZwyzwWU7o;License: Standard Youtube License