
Introduction To Statistics And Data Analysis
6th Edition
ISBN: 9781337793612
Author: PECK, Roxy.
Publisher: Cengage Learning,
expand_more
expand_more
format_list_bulleted
Videos
Textbook Question
Chapter 16.2, Problem 9E
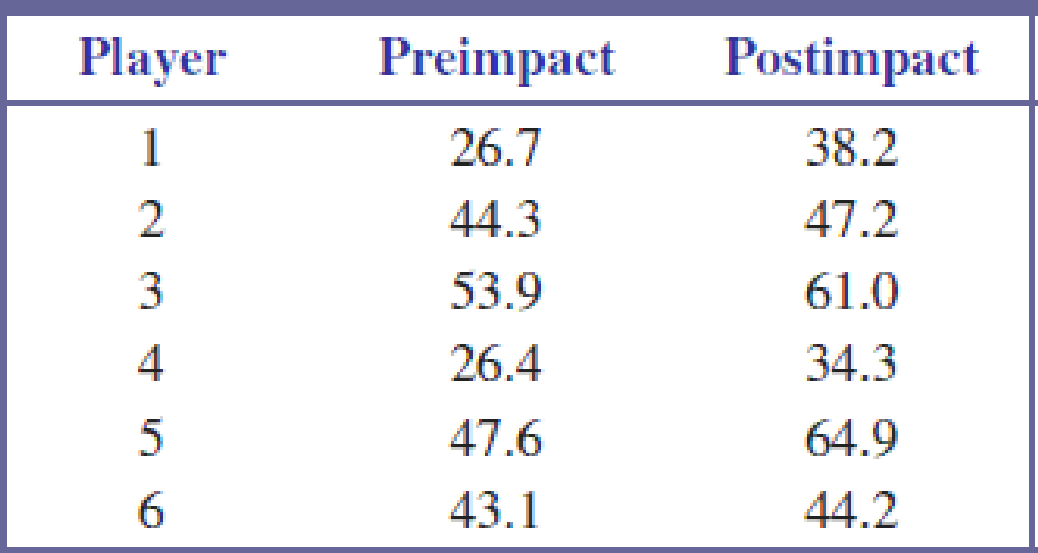
Peak force (N) on the hand was measured just prior to impact and just after impact on a backhand drive for six advanced tennis players. The resulting data, from the paper “Forces on the Hand in the Tennis One-Handed Backhand” (International Journal of Sport Biomechanics [1991]: 282–292), are given in the accompanying table.
Use the signed-rank test to determine if the mean postimpact force is greater than the mean preimpact force by more than 6.
Expert Solution & Answer

Trending nowThis is a popular solution!

Students have asked these similar questions
A Canadian study measuring depression level in teens (as reported in the Journal of Adolescence, vol. 25, 2002) randomly sampled 112 male teens and 101 female teens, and scored them on a common depression scale (higher score representing more depression). The researchers suspected that the mean depression score for male teens is higher than for female teens, and wanted to check whether data would support this hypothesis.
If μ1 and μ2 represent the mean depression score for male teens and female teens respectively, which of the following is an appropriate pair of hypotheses in this case? Check all that apply.
A Canadian study measuring depression level in teens (as reported in the Journal of Adolescence, vol. 25, 2002) randomly sampled 112 male teens and 101 female teens, and scored them on a common depression scale (higher score representing more depression). The researchers suspected that the mean depression score for male teens is higher than for female teens, and wanted to check whether data would support this hypothesis.
What conclusion can you draw from the output?
The data provide sufficient evidence to reject H0 and to conclude that the mean depression score for male teens is larger than that of female teens.
The data provide sufficient evidence to conclude that male and female teens do not differ in mean depression score.
The data do not provide sufficient evidence to conclude that the mean depression score of male teens is larger than that of female teens.
The data do not provide sufficient evidence to reject H0, so we accept it, and conclude that male and female teens do…
The table below summarizes a data set we first encountered in Exercise 6.29 that examines the responses of a random sample of college graduates and nongraduates on the topic of oil drilling. Complete a chi-square test for these data to check whether there is a statistically significant difference in responses from college graduates and non-graduates.
χ2:?
df:?
Conclusion:
There is insufficient evidence that there is an association between support for off-shore drilling and having a college degree
There is strong evidence that the proportion of those supporting off-shore drilling is greater than those having a college degree
There is insufficient evidence that the proportion of those supporting off-shore drilling is greater than those having a college degree
There is strong evidence that there is an association between support for off-shore drilling and having a college degree
Chapter 16 Solutions
Introduction To Statistics And Data Analysis
Ch. 16.1 - Urinary fluoride concentration (in parts per...Ch. 16.1 - Prob. 2ECh. 16.1 - Prob. 3ECh. 16.1 - A blood lead level of 70 mg/ml has been commonly...Ch. 16.1 - The effectiveness of antidepressants in treating...Ch. 16.1 - Prob. 6ECh. 16.1 - Prob. 7ECh. 16.2 - The effect of a restricted diet in the treatment...Ch. 16.2 - Peak force (N) on the hand was measured just prior...Ch. 16.2 - In an experiment to study the way in which...
Ch. 16.2 - Prob. 11ECh. 16.2 - Prob. 12ECh. 16.2 - Prob. 13ECh. 16.2 - Prob. 14ECh. 16.2 - Prob. 15ECh. 16.2 - Prob. 16ECh. 16.2 - Prob. 17ECh. 16.2 - The signed-rank test can be adapted for use in...Ch. 16.3 - Prob. 19ECh. 16.3 - Prob. 20ECh. 16.3 - The given data on phosphorus concentration in...Ch. 16.3 - Prob. 22ECh. 16.3 - Prob. 23ECh. 16.3 - The following data on amount of food consumed (g)...Ch. 16.3 - The article Effect of Storage Temperature on the...
Knowledge Booster


Learn more about
Need a deep-dive on the concept behind this application? Look no further. Learn more about this topic, statistics and related others by exploring similar questions and additional content below.Similar questions
- Researchers recruited a sample of 40 female and 40 male heterosexual Caucasian undergraduate students from British universities for a study of the attractiveness of body types. Among adults, a body mass index (BMI, in kg/m2 ) value between 18.5 and 24.9is considered healthy, but attractiveness may not be entirely about health. Using a 3D computer avatar, participants built what they considered the ideal body of an adult of their own gender. The Minitab output for the mean ideal BMI of the women and of the men respectively is shown. From Barbie dolls to runway models, women in Western countries are exposed to unrealistically thin and arguably unhealthy body standards for their gender. Does the study provide evidence that young Caucasian women in British universities, on average, aim for an unhealthy ideal body type (corresponding to a BMI less than 18.5 )? test statistic,t = p-value =arrow_forwardThe NAEP considers that a national average of 283 is an acceptable performance. Using α = .05, run a two-tail t-test for one sample to test Ho: µ=283 for the 2019 scores. Report the t-obt, df, and p-values. Would you reject the null hypothesis that the 2019 scores come from a population with average 283? If this is the case, does it come from a population from larger or smaller average?arrow_forwardEvans conducted a study to determine if the frequency and characteristics of pediatric problems in elderly patients with diabetes present differences with respect to patients of the same age, but without diabetes. The individuals studied, interned in a clinic, were between 70 and 90 years old. Among the researchers' findings are the following statistics. with respect to the scores on the deep tendon reflexes meters:Sample without Diabetes: 79 / 2.1 / 1.1With Diabetes: 74 / 1.6 / 1.2Is it possible to conclude, based on the data, that, on average, diabetic patients they have reduced deep tendon reflexes in comparison with patients without diabetes of the same age?arrow_forward
- The systolic blood pressure of individuals is thought to be related to both age and weight. For a random sample of 11 men, the following data were obtained. Systolic Blood pressuex1 Age (years)x2 Weight (pounds)x3 132 52 173 143 59 184 153 67 194 162 73 211 154 64 196 168 74 220 137 54 188 149 61 188 159 65 207 128 46 167 166 72 217 a) Use level of significance 5%. (Use 2 decimal places for t and 3 decimal places for the P-value.) t P value ?2 ?3 b) Find a 90% confidence interval for each coefficient. (Use 2 decimal places.) lower limit upper limit ?2 ?3 c) Suppose Michael is 68 years old and weighs 192 pounds. Predict his systolic blood pressure, and find a 90% confidence range for your prediction. (Use 1 decimal place.) prediction lower limit upper limitarrow_forwardManagers of an outdoor coffee stand in Coast City are examining the relationship between (hot) coffee sales and daily temperature, hoping to be able to predict a day's total coffee sales from the maximum temperature that day. The bivariate data values for the coffee sales (denoted by , in dollars) and the maximum temperature (denoted by , in degrees Fahrenheit) for each of fifteen randomly selected days during the past year are given below. These data are plotted in the scatter plot in Figure 1.arrow_forwardThe article “Dynamics of Insulin Action in Hypertension: Assessment from Minimal ModelInterpretation of Intravenous Glucose Tolerance Test Data” (R. Burattini, M. Morettini, etal., Med Biol Eng Comput, 2011:831–841) compared levels of an insulin sensitivity index SIin patients with high blood pressure and patients with normal blood pressure. Ten patientswith high blood pressure had a mean value of 3.4 with a standard deviation of 0.6, and eightpatients with normal blood pressure had a mean value of 7.9 with a standard deviation of0.6. Units are 10−5 · min−1 · pmol−1. Find a 98% confidence interval for the difference inmean levels between those with high blood pressure and those with normal blood pressure.arrow_forward
- A nationwide study of undergraduate students reported that the mean number of drinks consumed per week during the spring semester is 7.96. The mean number of drinks consumed per week at USC is 7.64 (s.d.=2.55, N=412 Health services is concerned that USC students are consuming significantly more alcohol per week than the national average. Using an alpha level of .05, Is there sufficient evidence to be concerned? Be sure to select the correct critical value for the alternative hypothesis, and then use this evidence to make your conclusionarrow_forwardCONSIDER that the data is UNCORRELATED use alpha .05. Provide the following: 1. CI of the F value 2. Statistical Interpretationarrow_forwardBased on a survey of a random sample of 900 adults in the United States, a journalist reports that A random sample of 100 movie goers was asked to state his or her gender and favorite soft drink available at the local movie theater. The results appear in the table below. Is there a relationship between gender and soft drink preference? Coke Diet Coke Sprite Male 23 11 12 Female 16 28 10 To analyze the results, which of the following tests is most appropriate? A)Chi-square test of independence B)Chi-square test of homogeneity C)Two sample t-test D)Matched pair t-test E)Chi-square goodness of fitarrow_forward
- Consider the accompanying data on flexural strength (MPa) for concrete beams of a certain type. 5.6 8.9 9.7 6.3 11.3 6.3 7.9 6.5 7.0 9.0 9.7 7.3 11.6 7.7 7.4 7.2 7.8 7.0 7.3 8.2 8.7 6.8 11.8 6.8 7.7 10.7 8.1 (a) Calculate a point estimate of the mean value of strength for the conceptual population of all beams manufactured in this fashion. [Hint: Σxi = 220.3.] (Round your answer to three decimal places.) (b) Calculate a point estimate of the strength value that separates the weakest 50% of all such beams from the strongest 50%. (c) Calculate a point estimate of the population standard deviation ?. [Hint: Σxi2 = 1871.39.] (Round your answer to three decimal places.) (d) Calculate a point estimate of the proportion of all such beams whose flexural strength exceeds 10 MPa. [Hint: Think of an observation as a "success" if it exceeds 10.] (Round your answer to three decimal places.)arrow_forwardLow-Birth-Weight Hospital Stays. Data on low-birthweight babies were collected over a 2-year period by 14 participating centers of the National Institute of Child Health and Human Development Neonatal Research Network. Results were reported by J. Lemons et al. in the on-line paper “Very Low Birth Weight Outcomes of the National Institute of ChildHealth and Human Development Neonatal Research Network” (Pediatrics, Vol. 107, No. 1, p. e1). For the 1084 surviving babies whose birth weights were 751– 1000 grams, the average length of stay in the hospital was 86 days, although one center had an average of 66 days and another had an average of 108 days. a. Can the mean lengths of stay be considered population means? Explain your answer.b. Assuming that the population standard deviation is 12 days, determine the z-score for a baby’s length of stay of 86 days at the center where the mean was 66 days.c. Assuming that the population standard deviation is 12 days, determine the z-score for a…arrow_forwardConsider the accompanying data on flexural strength (MPa) for concrete beams of a certain type. 8.3 7.4 7.0 6.8 7.8 9.7 5.0 6.3 6.8 9.0 7.7 7.3 7.4 11.8 6.3 7.7 11.6 7.2 11.3 9.7 10.7 7.0 7.9 8.7 7.9 8.1 6.5 (a) Calculate a point estimate of the mean value of strength for the conceptual population of all beams manufactured in this fashion. [Hint: Σxi = 218.9.] (Round your answer to three decimal places.) MPa(b) Calculate a point estimate of the strength value that separates the weakest 50% of all such beams from the strongest 50%. MPa(c) Calculate a point estimate of the population standard deviation ?. [Hint: Σxi2 = 1851.35.] (Round your answer to three decimal places.) MPa(d) Calculate a point estimate of the proportion of all such beams whose flexural strength exceeds 10 MPa. [Hint: Think of an observation as a "success" if it exceeds 10.] (Round your answer to three decimal places.)(e) Calculate a point estimate of the population coefficient of variation ?/?. (Round…arrow_forward
arrow_back_ios
SEE MORE QUESTIONS
arrow_forward_ios
Recommended textbooks for you
 Glencoe Algebra 1, Student Edition, 9780079039897...AlgebraISBN:9780079039897Author:CarterPublisher:McGraw Hill
Glencoe Algebra 1, Student Edition, 9780079039897...
Algebra
ISBN:9780079039897
Author:Carter
Publisher:McGraw Hill
Hypothesis Testing using Confidence Interval Approach; Author: BUM2413 Applied Statistics UMP;https://www.youtube.com/watch?v=Hq1l3e9pLyY;License: Standard YouTube License, CC-BY
Hypothesis Testing - Difference of Two Means - Student's -Distribution & Normal Distribution; Author: The Organic Chemistry Tutor;https://www.youtube.com/watch?v=UcZwyzwWU7o;License: Standard Youtube License