
(a)
Draw the scatter diagram.
(a)
Explanation of Solution
Figure 1 shows the scatter diagram of Y and X.
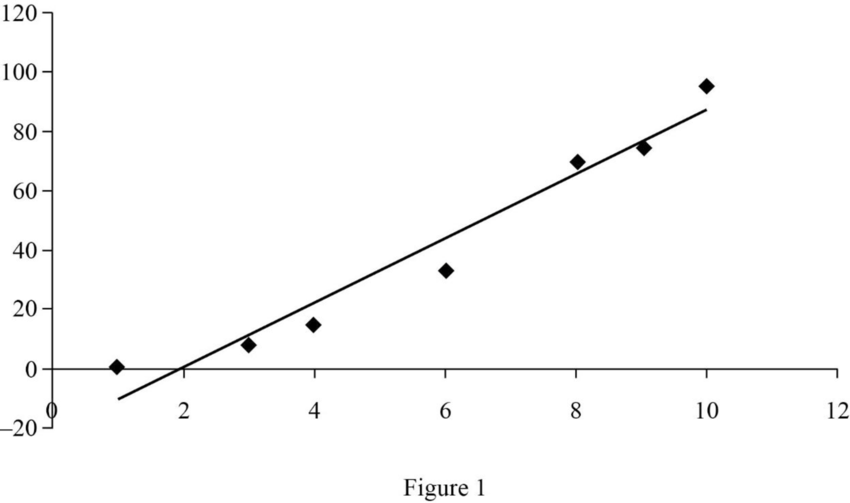
In the above figure, the position of the scatters shows a positive relationship between variables Y and X.
Scatter diagram: The scatter diagram shows the value of two variables plotted along two axes. Each scatter represents the relationship between the variables.
(b)
Calculate the linear relationship.
(b)
Explanation of Solution
The least squares regression line is shown below:
Where b0 is the y-intercept and b1 is the slope of the regression line.
The least squares regression line is calculated as follows:
Table 1
| Xi | Yi | Xi2 | Yi2 | XiY1 | |
| 1 | 1 | 1 | 1 | 1 | 1 |
| 2 | 3 | 8 | 9 | 64 | 24 |
| 3 | 4 | 15 | 16 | 225 | 60 |
| 4 | 6 | 33 | 36 | 1089 | 198 |
| 5 | 9 | 75 | 81 | 5625 | 675 |
| 6 | 8 | 70 | 64 | 4900 | 560 |
| 7 | 10 | 95 | 100 | 9025 | 950 |
| Total | 41 | 297 | 307 | 20,929 | 2,468 |
These table values are obtained using a spreadsheet.
This is evidence to conclude that variables X and Y are in a linear relationship.
Want to see more full solutions like this?
Chapter 16 Solutions
Statistics for Management and Economics (Book Only)

- UBC coaching center has two branches in Dhaka: one in Dhanmondi (Branch A) and another one in Mohammadpur (Branch B). To understand their students' performance, the coaching center conducts the same test in both branches. A sample of 8 students have been selected from branches A and B respectively, and the following table shows data on their performance. Use appropriate non-parametric methods on the data to find out whether there is a statistically significant correlation between the ranks of the students’ performance of the two branches.?arrow_forward10.61 The per-store daily customer count (i.e., the mean number of customers in a store in one day) for a nationwide convenience store chain that operates nearly 10,000 stores has been steady, at 900, for some time. To increase the customer count, the chain is considering cutting prices for coffee beverages. The question to be determined is how much to cut prices to increase the daily customer count without reducing the gross margin on coffee sales too much. You decide to carry out an experiment in a sample of 24 stores where customer counts have been running almost exactly at the national average of 900. In 6 of the stores, the price of a small coffee will now be $0.59, in 6 stores the price of a small coffee will now be $0.69, in 6 stores, the price of a small coffee will now be $0.79, and in 6 stores, the price of a small coffee will now be $0.89. After four weeks of selling the coffee at the new price, the daily customer count in the stores was recorded and stored in . At the 0.05…arrow_forwardIn a study aimed at creating reference values, abdominal circumference (measured in cm) was measured in adult men. It was found that the relationship to age could be described as abdominal circumference = 82 + 0.3 x age a) What is the analysis that produces such a formula called? b) At what age is the average abdominal circumference 100 cm?arrow_forward
- Suppose that we want to compare the cholestrol contents of four competing diet foods on the basis of the following data (in milligrams per package) which were obtained for three 6-ounce packages of each of the diet foods: Diet food A: 3.6 4.1 4.0 Diet food B : 3.1 3.2 3.9 Diet food C: 3.2 3.5 3.5 Diet food D: 3.5 3.8 3.8 a) Fill in the blanks below. b) Test at the 0.05 level of significance whether the differences among means obtained for the four competing diet foods ( Diet A, B, C, D ) are significant? (Ftable=4.07) ONE-WAY ANOVA TABLE Source of Variation Degrees of Freedom Sum of Squares Mean Square F Treatments ? 0.54 ? ? Error ? ? ? Total ? 1.18arrow_forwardPrevious answer was poorly formatedarrow_forwardWhy can we not use first differences when we have independent cross sections in two years (as opposed to panel data)?arrow_forward
- Explain Conditional Mean Independence by considering a regression with two regressors?arrow_forwardA researcher is interested to search students’ willingness in participating in sport. Students are at undergraduate level and form different specialization studying in particular college. The researcher wants to interview students from all specializations in order to find whether there is a link between specialization and participation in sport. He arranges the by undergraduate specialization, next, he selects students randomly within each specialization. What is the name of sampling method?arrow_forwardStates (and provinces) that have control over taxation sometimes reduce taxes in an attempt to spur economic growth. Suppose that you are hired by a state to estimate the effect of corporate tax rates on, say, the growth in per capita gross state product (GSP).(i) What kind of data would you need to collect to undertake a statistical analysis?(ii) Is it feasible to do a controlled experiment? What would be required?(iii) Is a correlation analysis between GSP growth and tax rates likely to be convincing? Explain.arrow_forward
- A salesman for a new manufacturer of cellular phones claims not only that they cost the retailer less but also that the percentage of defective cellular phones found among his products, ( p1 ), will be no higher than the percentage of defectives found in a competitor's line, ( p2 ). To test this statement, the retailer took a random sample of 130 of the salesman's cellular phones and 110 of the competitor's cellular phones. The retailer found that 10 of the salesman's cellular phones and 5 of the competitor's cellular phones were defective. Does the retailer have enough evidence to reject the salesman's claim? Use a significance level of α=0.05 for the test. Step 5 of 6 : Determine the decision rule for rejecting the null hypothesis H0 . Round the numerical portion of your answer to three decimal places.arrow_forwardResearchers conducted a prospective cohort study to assess the association between dietary supplements and cognitive ability among children. A total of 500 children age 12-17 years who take an omega-3 fatty acid supplement are compared with 500 children age 12-17 years who do not take an omega-3 fatty acid supplement. Researchers follow the children for 2 years. During this time, 300 children who take the supplement earn what is classified as a “high” score on a cognitive test while 200 children who do not take the supplement earn what is classified as a “high” score on the same cognitive test. Show calculations. a) Construct a 2x2 table from the information presented above b) The risk difference is:arrow_forwardIs it possible for an econometric study to have internal validity but notexternal validity?arrow_forward

 Principles of Economics (12th Edition)EconomicsISBN:9780134078779Author:Karl E. Case, Ray C. Fair, Sharon E. OsterPublisher:PEARSON
 Engineering Economy (17th Edition)EconomicsISBN:9780134870069Author:William G. Sullivan, Elin M. Wicks, C. Patrick KoellingPublisher:PEARSON
 Principles of Economics (MindTap Course List)EconomicsISBN:9781305585126Author:N. Gregory MankiwPublisher:Cengage Learning
 Managerial Economics: A Problem Solving ApproachEconomicsISBN:9781337106665Author:Luke M. Froeb, Brian T. McCann, Michael R. Ward, Mike ShorPublisher:Cengage Learning
 Managerial Economics & Business Strategy (Mcgraw-...EconomicsISBN:9781259290619Author:Michael Baye, Jeff PrincePublisher:McGraw-Hill Education