Probability and Statistics for Engineers and Scientists
9th Edition
ISBN: 9780321629111
Author: Ronald E. Walpole, Raymond H. Myers, Sharon L. Myers, Keying Ye
Publisher: Prentice Hall
expand_more
expand_more
format_list_bulleted
Concept explainers
Videos
Question
Chapter 1.7, Problem 13E
(a)
To determine
Find the sample mean.
Find the median.
(a)
Expert Solution
Answer to Problem 13E
The sample mean is 124.3.
The median is 120.
Explanation of Solution
Calculation:
Step-by-step procedure to obtain the mean and median using MINITAB software:
- Choose Stat > Basic Statistics > Display
Descriptive Statistics . - In Variables enter the column hour.
- Choose option statistics, and select Mean, Median.
- Click OK.
Output obtained using MINITAB software is given below:
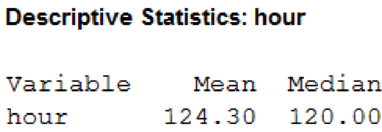
From the MINITAB output, the sample mean is 124.3, and the median is 120.
(b)
To determine
Identify the feature in this data set that is responsible for the substantial difference between the two.
(b)
Expert Solution
Explanation of Solution
Step-by-step procedure to obtain the boxplot using MINITAB software:
- Choose Graph > Boxplot.
- Under One Y, choose Simple. Click OK.
- In Graph variables, enter the data of hour.
- Click OK.
Output obtained using MINITAB software is given below:
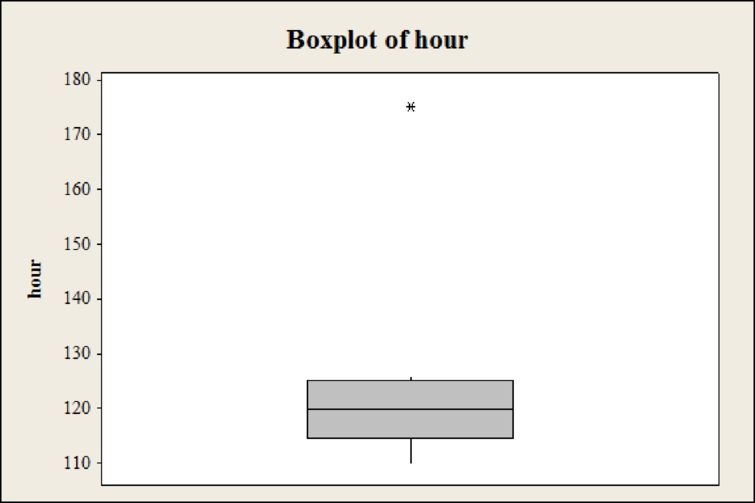
From the boxplot, it is clear that the observation 175 is an extreme value when compared to the remaining observations.
Want to see more full solutions like this?
Subscribe now to access step-by-step solutions to millions of textbook problems written by subject matter experts!
Chapter 1 Solutions
Probability and Statistics for Engineers and Scientists
Ch. 1.3 - The following measurements were recorded for the...Ch. 1.3 - According to the journal Chemical Engineering, an...Ch. 1.3 - A certain polymer is used for evacuation systems...Ch. 1.3 - In a study conducted by the Department of...Ch. 1.3 - Twenty adult males between the ages of 30 and 40...Ch. 1.3 - The tensile strength of silicone rubber is thought...Ch. 1.4 - Consider the drying time data for Exercise 1.1 on...Ch. 1.4 - Prob. 8ECh. 1.4 - Exercise 1.3 on page 13 showed tensile strength...Ch. 1.4 - Prob. 10E
Ch. 1.4 - Prob. 11ECh. 1.4 - For Exercise 1.6 on page 13, compute the sample...Ch. 1.7 - Prob. 13ECh. 1.7 - A tire manufacturer wants to determine the inner...Ch. 1.7 - Five independent coin tosses result in H H H H H....Ch. 1.7 - Show that the n pieces of information in are not...Ch. 1.7 - Prob. 17ECh. 1.7 - The following scores represent the final...Ch. 1.7 - Prob. 19ECh. 1.7 - The following data represent the length of life,...Ch. 1.7 - Prob. 21ECh. 1.7 - Prob. 22ECh. 1.7 - Prob. 23ECh. 1.7 - Prob. 24ECh. 1.7 - Prob. 25ECh. 1.7 - Prob. 26ECh. 1.7 - Prob. 27ECh. 1.7 - Prob. 28ECh. 1.7 - Prob. 29ECh. 1.7 - Prob. 30ECh. 1.7 - Prob. 31ECh. 1.7 - Prob. 32E
Knowledge Booster


Learn more about
Need a deep-dive on the concept behind this application? Look no further. Learn more about this topic, statistics and related others by exploring similar questions and additional content below.Recommended textbooks for you
 MATLAB: An Introduction with ApplicationsStatisticsISBN:9781119256830Author:Amos GilatPublisher:John Wiley & Sons Inc
 Probability and Statistics for Engineering and th...StatisticsISBN:9781305251809Author:Jay L. DevorePublisher:Cengage Learning
 Statistics for The Behavioral Sciences (MindTap C...StatisticsISBN:9781305504912Author:Frederick J Gravetter, Larry B. WallnauPublisher:Cengage Learning
 Elementary Statistics: Picturing the World (7th E...StatisticsISBN:9780134683416Author:Ron Larson, Betsy FarberPublisher:PEARSON
 The Basic Practice of StatisticsStatisticsISBN:9781319042578Author:David S. Moore, William I. Notz, Michael A. FlignerPublisher:W. H. Freeman
 Introduction to the Practice of StatisticsStatisticsISBN:9781319013387Author:David S. Moore, George P. McCabe, Bruce A. CraigPublisher:W. H. Freeman
MATLAB: An Introduction with Applications
Statistics
ISBN:9781119256830
Author:Amos Gilat
Publisher:John Wiley & Sons Inc
Probability and Statistics for Engineering and th...
Statistics
ISBN:9781305251809
Author:Jay L. Devore
Publisher:Cengage Learning
Statistics for The Behavioral Sciences (MindTap C...
Statistics
ISBN:9781305504912
Author:Frederick J Gravetter, Larry B. Wallnau
Publisher:Cengage Learning
Elementary Statistics: Picturing the World (7th E...
Statistics
ISBN:9780134683416
Author:Ron Larson, Betsy Farber
Publisher:PEARSON
The Basic Practice of Statistics
Statistics
ISBN:9781319042578
Author:David S. Moore, William I. Notz, Michael A. Fligner
Publisher:W. H. Freeman
Introduction to the Practice of Statistics
Statistics
ISBN:9781319013387
Author:David S. Moore, George P. McCabe, Bruce A. Craig
Publisher:W. H. Freeman
The Shape of Data: Distributions: Crash Course Statistics #7; Author: CrashCourse;https://www.youtube.com/watch?v=bPFNxD3Yg6U;License: Standard YouTube License, CC-BY
Shape, Center, and Spread - Module 20.2 (Part 1); Author: Mrmathblog;https://www.youtube.com/watch?v=COaid7O_Gag;License: Standard YouTube License, CC-BY
Shape, Center and Spread; Author: Emily Murdock;https://www.youtube.com/watch?v=_YyW0DSCzpM;License: Standard Youtube License