
Concept explainers
Videos
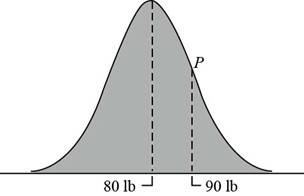
Consider the
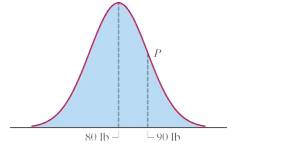
Figure 17-12
a. Find the mean
b. Find the median M of the distribution.
c. Find the standard deviation
(a)
To find:
The mean
Answer to Problem 1E
Solution:
The mean
Explanation of Solution
Given:
The normal distribution curve is,

With P as a point of inflection of the curve.
Definition:
The point of intersection of the horizontal (data) axis and the line of symmetry of the normal curve, the center of the distribution. The center corresponds to both the median and mean of the distribution.
Calculation:
From the given figure, it is seen that the point of intersection of the horizontal axis and the line of symmetry is at
This implies that the mean
Conclusion:
The mean
(b)
To find:
The median M of the distribution.
Answer to Problem 1E
Solution:
The median M of the distribution is
Explanation of Solution
Given:
The normal distribution curve is,
With P as a point of inflection of the curve.
Definition:
The point of intersection of the horizontal (data) axis and the line of symmetry of the normal curve, the center of the distribution. The center corresponds to both the median and mean of the distribution.
Calculation:
From the given figure, it is seen that the point of intersection of the horizontal axis and the line of symmetry is at
This implies that the median M of the distribution.is
Conclusion:
The median M of the distribution is
(c)
To find:
The standard deviation
Answer to Problem 1E
Solution:
The standard deviation
Explanation of Solution
Given:
The normal distribution curve is,

With P as a point of inflection of the curve.
Definition:
The standard deviation of the normal distribution is the horizontal distance between the axis of symmetry of the curve and one of the two points of inflection.
Calculation:
From the given figure, it is seen that the point of intersection of the horizontal axis and the line of symmetry is at
The point of inflection of the curve is
Therefore the distance between the point of inflection and the line of symmetry is,
This implies that the standard deviation
Conclusion:
The standard deviation
Want to see more full solutions like this?
Chapter 17 Solutions
MYMATHLAB ACCESS F/MGF 1107


 Glencoe Algebra 1, Student Edition, 9780079039897...AlgebraISBN:9780079039897Author:CarterPublisher:McGraw Hill