For 2014, Lindell Company reported its most significant decline in net income in years. At the end of the year, H. Finn, the president, is presented with the following condensed comparative income statement: Instructions 1. Prepare a comparative income statement with horizontal analysis for the two-year period, using 2013 as the base year. Round to one decimal place. 2. To the extent the data permit, comment on the significant relationships revealed by the horizontal analysis prepared in(1).
For 2014, Lindell Company reported its most significant decline in net income in years. At the end of the year, H. Finn, the president, is presented with the following condensed comparative income statement: Instructions 1. Prepare a comparative income statement with horizontal analysis for the two-year period, using 2013 as the base year. Round to one decimal place. 2. To the extent the data permit, comment on the significant relationships revealed by the horizontal analysis prepared in(1).

Corporate Financial Accounting
14th Edition
ISBN:9781305653535
Author:Carl Warren, James M. Reeve, Jonathan Duchac
Publisher:Carl Warren, James M. Reeve, Jonathan Duchac
Chapter14: Financial Statement Analysis
Section: Chapter Questions
Problem 14.1EX: Vertical analysis of income statement Revenue and expense data for Innovation Quarter Inc. for two...

Related questions
Question
For 2014, Lindell Company reported its most significant decline in net income in years. At the end of the year, H. Finn, the president, is presented with the following condensed comparative income statement:
Instructions
1. Prepare a comparative income statement with horizontal analysis for the two-year period, using 2013 as the base year. Round to one decimal place.
2. To the extent the data permit, comment on the significant relationships revealed by the horizontal analysis prepared in(1).
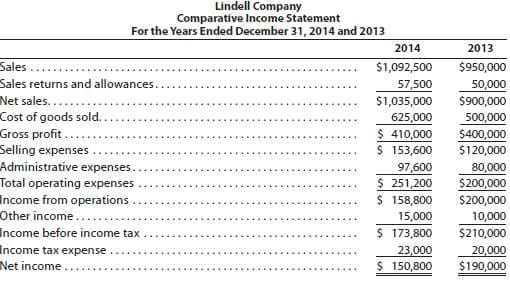
Transcribed Image Text:Lindell Company
Comparative Income Statement
For the Years Ended December 31, 2014 and 2013
2014
2013
Sales
$1,092,500
$950,000
Sales returns and allowances.
57,500
$1,035,000
50,000
Net sales.....
Cost of goods sold.
Gross profit.....
Selling expenses
Administrative expenses.
Total operating expenses
$900,000
625,000
500,000
$ 410,000
$ 153,600
$400,000
$120,000
97,600
$ 251,200
$ 158,800
15,000
80,000
$200,000
$200,000
10,000
Income from operations
Other income ..
Income before income tax
$ 173,800
$210,000
Income tax expense
23,000
$ 150,800
20,000
Net income.
$190,000
Expert Solution
This question has been solved!
Explore an expertly crafted, step-by-step solution for a thorough understanding of key concepts.

This is a popular solution!

Trending now
This is a popular solution!

Step by step
Solved in 3 steps with 3 images

Knowledge Booster


Learn more about
Need a deep-dive on the concept behind this application? Look no further. Learn more about this topic, accounting and related others by exploring similar questions and additional content below.Recommended textbooks for you
Corporate Financial Accounting
Accounting
ISBN:
9781305653535
Author:
Carl Warren, James M. Reeve, Jonathan Duchac
Publisher:
Cengage Learning

Intermediate Accounting: Reporting And Analysis
Accounting
ISBN:
9781337788281
Author:
James M. Wahlen, Jefferson P. Jones, Donald Pagach
Publisher:
Cengage Learning

Cornerstones of Financial Accounting
Accounting
ISBN:
9781337690881
Author:
Jay Rich, Jeff Jones
Publisher:
Cengage Learning
Corporate Financial Accounting
Accounting
ISBN:
9781305653535
Author:
Carl Warren, James M. Reeve, Jonathan Duchac
Publisher:
Cengage Learning
Intermediate Accounting: Reporting And Analysis
Accounting
ISBN:
9781337788281
Author:
James M. Wahlen, Jefferson P. Jones, Donald Pagach
Publisher:
Cengage Learning
Cornerstones of Financial Accounting
Accounting
ISBN:
9781337690881
Author:
Jay Rich, Jeff Jones
Publisher:
Cengage Learning

Survey of Accounting (Accounting I)
Accounting
ISBN:
9781305961883
Author:
Carl Warren
Publisher:
Cengage Learning

Financial And Managerial Accounting
Accounting
ISBN:
9781337902663
Author:
WARREN, Carl S.
Publisher:
Cengage Learning,

Financial & Managerial Accounting
Accounting
ISBN:
9781285866307
Author:
Carl Warren, James M. Reeve, Jonathan Duchac
Publisher:
Cengage Learning