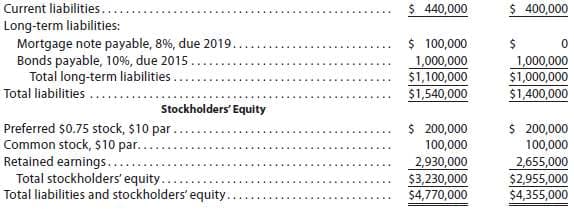
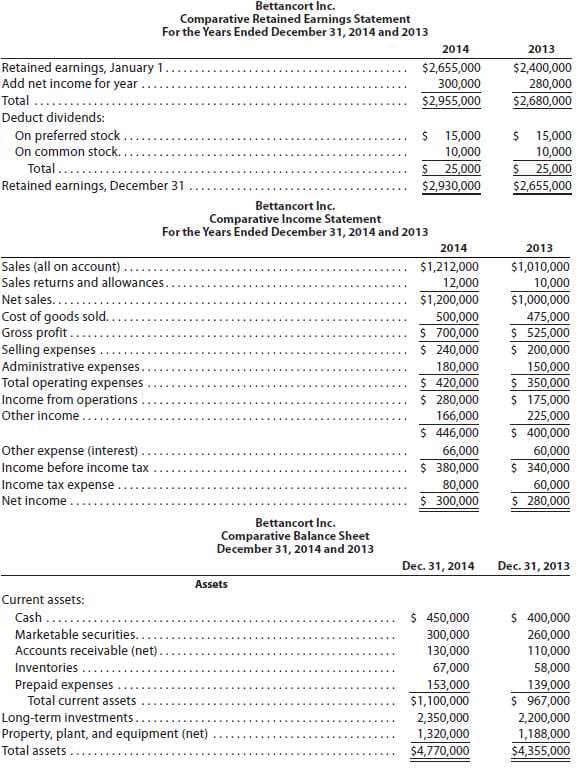
The comparative financial statements of Bettancort Inc. are as follows. The market price of Bettancort Inc. common stock was $71.25 on December 31, 2014. Instructions Determine the following measures for 2014, rounding to one decimal place: 1. a.Working capital b. Current ratio c. Quick ratio d. Accounts receivable turnover e. Number of days' sales in receivables f. Inventory turnover g. Number of days' sales in inventory h. Ratio of fixed assets to long-term liabilities i. Ratio of liabilities to stockholders’ equity j. Number of times interest charges are earned k. Number of times preferred dividends are earned 2. a. Ratio of net sales to assets b. Rate earned on total assets c. Rate earned on stockholders' equity d. Rate earned on common stockholders' equity e. Earnings per share on common stock f. Price-earnings ratio g. Dividends per share of common stock h. Dividend yield


The comparative financial statements of Bettancort Inc. are as follows. The market price of Bettancort Inc. common stock was $71.25 on December 31, 2014.
Instructions
Determine the following measures for 2014, rounding to one decimal place:
1. a.Working capital
b.
c. Quick ratio
d. Accounts receivable turnover
e. Number of days' sales in receivables
f. Inventory turnover
g. Number of days' sales in inventory
h. Ratio of fixed assets to long-term liabilities
i. Ratio of liabilities to stockholders’ equity
j. Number of times interest charges are earned
k. Number of times preferred dividends are earned
2. a. Ratio of net sales to assets
b. Rate earned on total assets
c. Rate earned on stockholders' equity
d. Rate earned on common stockholders' equity
e. Earnings per share on common stock
f. Price-earnings ratio
g. Dividends per share of common stock
h. Dividend yield


Trending now
This is a popular solution!

Step by step
Solved in 4 steps with 6 images


