
a:
Derive the regression equation.
a:
Explanation of Solution
The ANOVA table output is obtained using the statistical software. The result is given below:
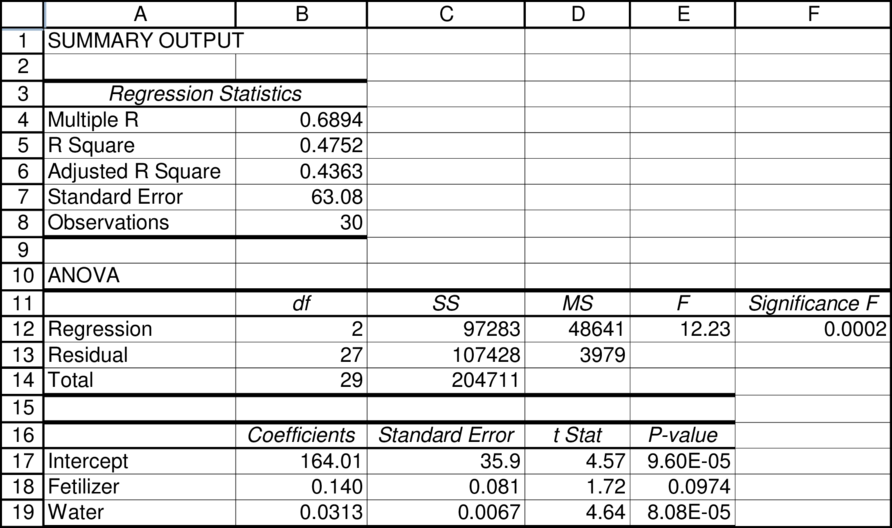
The general regression line can be derived as follows:Intercept is denoted by IC and the coefficient is denoted by CE
Substitute the respective value in Equation (1) to derive the regression equation.
b:
Testing the hypothesis.
b:
Explanation of Solution
The null hypothesis (H0)
The calculated t value is 1.72 and the p value is 0.0974. Since the p value is significantly different from 0, the alternate hypothesis is not accepted.
c:
Testing the new hypothesis.
c:
Explanation of Solution
The null hypothesis (H0)
The calculated t value is 4.64 and the p value is 0.0001. Since the p value is nearly equal to 0, the alternate hypothesis is accepted.
d:
Standard error.
d:
Explanation of Solution
The standard error is 63.08 and the R square value is 0.4572. This indicates the good fit of the model.
e
Normality requirement.
e
Explanation of Solution
The distribution of the variable is obtained using the statistical software. The result is given below:
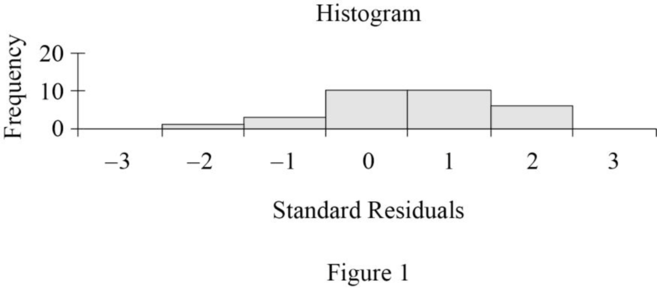
The required condition is that the variable should be distributed normally. Since the histogram is bell shaped, the error variable is distributed normally. Thus, the required condition is satisfied.
The variance of the error is obtained using the statistical software. The result is given below:
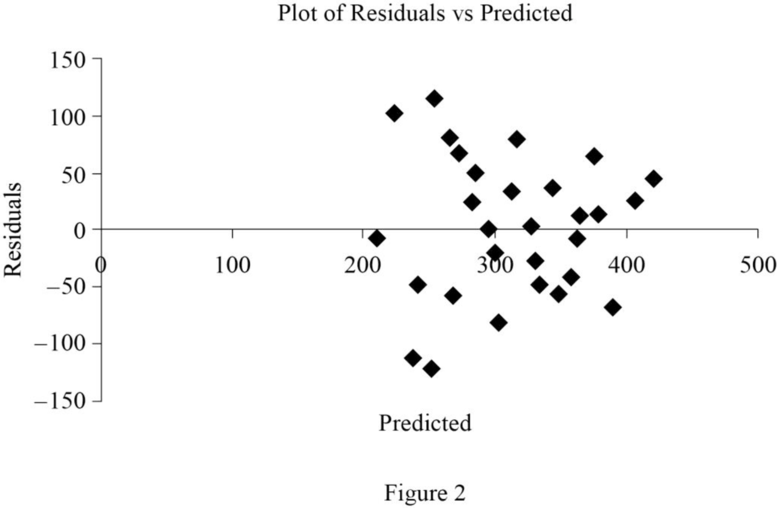
From Figure 2, it is known that the error variable is not constant.
f:
Calculate the upper limit and the lower limit.
f:
Explanation of Solution
The upper limit and the lower limit areobtained using the statistical software. The result is given below:
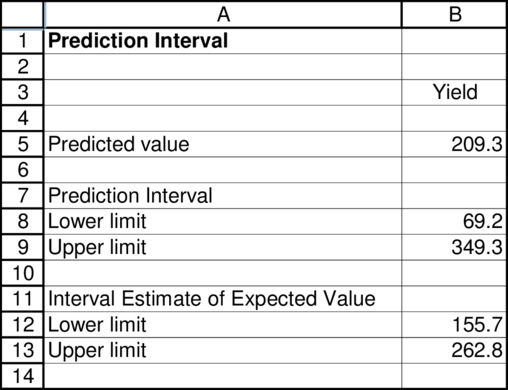
The lower limit is 69.2 and the upper limit is 349.3.
Want to see more full solutions like this?
Chapter 17 Solutions
Statistics for Management and Economics (Book Only)

- With d-statistics 0.354 and du 1.715, What can you conclude about the Durbin Watson Test?arrow_forwardA salesman for a new manufacturer of cellular phones claims not only that they cost the retailer less but also that the percentage of defective cellular phones found among his products, ( p1 ), will be no higher than the percentage of defectives found in a competitor's line, ( p2 ). To test this statement, the retailer took a random sample of 185 of the salesman's cellular phones and 150 of the competitor's cellular phones. The retailer found that 22 of the salesman's cellular phones and 11 of the competitor's cellular phones were defective. Does the retailer have enough evidence to reject the salesman's claim? Use a significance level of α=0.05 for the test. Step 1 of 6 : State the null and alternative hypotheses for the test.arrow_forwardA salesman for a new manufacturer of cellular phones claims not only that they cost the retailer less but also that the percentage of defective cellular phones found among his products, ( p1 ), will be no higher than the percentage of defectives found in a competitor's line, ( p2 ). To test this statement, the retailer took a random sample of 130 of the salesman's cellular phones and 110 of the competitor's cellular phones. The retailer found that 10 of the salesman's cellular phones and 5 of the competitor's cellular phones were defective. Does the retailer have enough evidence to reject the salesman's claim? Use a significance level of α=0.05 for the test. Step 5 of 6 : Determine the decision rule for rejecting the null hypothesis H0 . Round the numerical portion of your answer to three decimal places.arrow_forward
- Is it possible for an econometric study to have internal validity but notexternal validity?arrow_forwardthe college of science surveys its graduating students to determine the starting salaries and the job market for the new graduates. the population of graduating students according to majors is recorded as follows: BS bio (85), BSM-CS (102), BSM-BA (78), and BSM-AS(75). If you would like to select 100 samples, how large must a sample be for each major using proportionate allocation?arrow_forwardWhat is differance between three sector ecnomoy and four sector ecnomoyarrow_forward
- A manufacturer of cat food was planning to survey households in the US to determine purchasing habits of cat owners. Among the questions to be included are those that relate to Where cat fat is primarily purchased. Whether dry or moist cat food is purchased. The number of cats living in the household. Whether the cat is pedigreed. Describe the population. For each of the four items listed, indicate whether the variable is categorical or numerical.arrow_forwardResearchers conducted a prospective cohort study to assess the association between dietary supplements and cognitive ability among children. A total of 500 children age 12-17 years who take an omega-3 fatty acid supplement are compared with 500 children age 12-17 years who do not take an omega-3 fatty acid supplement. Researchers follow the children for 2 years. During this time, 300 children who take the supplement earn what is classified as a “high” score on a cognitive test while 200 children who do not take the supplement earn what is classified as a “high” score on the same cognitive test. Show calculations. a) Construct a 2x2 table from the information presented above b) The risk difference is:arrow_forwardWhy can we not use first differences when we have independent cross sections in two years (as opposed to panel data)?arrow_forward
- In your own words, discuss the relationship between a t-test and a confidence interval.arrow_forwardA company is considering an organizational change which entails adopting the use of self-managed work teams which they hope will lead to higher levels of employee satisfaction. In order to assess the attitudes of employees of the company towards this change a sample of 250 employees was selected and asked whether they favor the institution of self-managed teams. Three responses were allowed: favor, neutral or oppose. The observed frequency of the results of the survey are shown below: Opinion Type of Job Favor Neutral Oppose Total Hourly Worker 25 40 35 100 Supervision 45 35 20 100 Manager 20 15 15 50 Total 90 90 70 250 Use this data to test the hypothesis that opinion and type of job are independent at the .025 level.arrow_forwardAverage prices (in dollars) were recorded for three types of beverage across all 8 major Australian states and territories. In how many states/territories is the average price of a cappuccino higher than the average price of a flat white?arrow_forward

 Principles of Economics (12th Edition)EconomicsISBN:9780134078779Author:Karl E. Case, Ray C. Fair, Sharon E. OsterPublisher:PEARSON
 Engineering Economy (17th Edition)EconomicsISBN:9780134870069Author:William G. Sullivan, Elin M. Wicks, C. Patrick KoellingPublisher:PEARSON
 Principles of Economics (MindTap Course List)EconomicsISBN:9781305585126Author:N. Gregory MankiwPublisher:Cengage Learning
 Managerial Economics: A Problem Solving ApproachEconomicsISBN:9781337106665Author:Luke M. Froeb, Brian T. McCann, Michael R. Ward, Mike ShorPublisher:Cengage Learning
 Managerial Economics & Business Strategy (Mcgraw-...EconomicsISBN:9781259290619Author:Michael Baye, Jeff PrincePublisher:McGraw-Hill Education