
Modern Business Statistics with Microsoft Office Excel (with XLSTAT Education Edition Printed Access Card) (MindTap Course List)
6th Edition
ISBN: 9781337115186
Author: David R. Anderson, Dennis J. Sweeney, Thomas A. Williams, Jeffrey D. Camm, James J. Cochran
Publisher: Cengage Learning
expand_more
expand_more
format_list_bulleted
Videos
Textbook Question
Chapter 17.6, Problem 39E
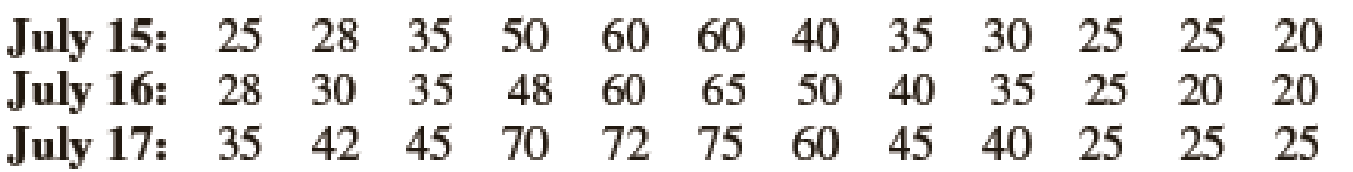
Air pollution control specialists in southern California monitor the amount of ozone, carbon dioxide, and nitrogen dioxide in the air on an hourly basis. The hourly time series data exhibit seasonality, with the levels of pollutants showing patterns over the hours in the day. On July 15, 16, and 17, the following levels of nitrogen dioxide were observed in the downtown area for the 12 hours from 6:00 A.M. to 6:00 P.M.
- a. Construct a time series plot. What type of pattern exists in the data?
- b. Identify the hourly seasonal indexes for the 12 readings each day.
- c. Deseasonalize the time series.
- d. Compute the linear trend equation for the deseasonalized data.
- e. Compute the deseasonalized trend forecasts for the 12 hours for July 18 and then adjust the trend forecasts using the seasonal indexes computed in part (b).
Expert Solution & Answer
Want to see the full answer?
Check out a sample textbook solution
Students have asked these similar questions
ASAP! Solve
Air pollution control specialists in Southern California monitor the amount of ozone, carbon dioxide, and nitrogen dioxide in the air on an hourly basis.
The hourly time series data exhibit seasonality, with the levels of pollutants showing patterns that vary over the hours in the day. On July 15, the following levels of nitrogen dioxide were observed at different intervals from 6:00 AM. to 6:00 PM:
Table 3.1
1089
528
257
2030
488
2081
384
200
522
1265
375
424
Compute the standard deviation and variance of nitrogen dioxide levels for the given data in above table.
Compute the z-score for nitrogen dioxide levels 522, 1018.
Create a box plot for consultation hours of the teachers. Which of the values, if any, are outliers? Show complete working of all calculations.
air pollution control specialists in southern california monitor the amount of ozone, carbon dioxide, and nitrogen dioxide in the air on an hourly basis. the hourly time series dataexhibit seasonality, with the levels of pollutants showing patterns over the hours in theday. on july 15, 16, and 17, the following levels of nitrogen dioxide were observed in thedowntown area for the 12 hours from 6:00 a.m. to 6:00 p.m.July 15: 25 28 35 50 60 60 40 35 30 25 25 20July 16: 28 30 35 48 60 65 50 40 35 25 20 20July 17: 35 42 45 70 72 75 60 45 40 25 25 25a. construct a time series plot. What type of pattern exists in the data?b. identify the hourly seasonal indexes for the 12 readings each day.c. deseasonalize the time series.d. Using Minitab or excel, compute the linear trend equation for the deseasonalized data.e. compute the deseasonalized trend forecasts for the 12 hours for july 18 and then adjustthe trend forecasts using the seasonal indexes computed in part (b).
air pollution control specialists in southern california monitor the amount of ozone, carbon dioxide, and nitrogen dioxide in the air on an hourly basis. the hourly time series dataexhibit seasonality, with the levels of pollutants showing patterns over the hours in theday. on july 15, 16, and 17, the following levels of nitrogen dioxide were observed in thedowntown area for the 12 hours from 6:00 a.m. to 6:00 p.m.July 15: 25 28 35 50 60 60 40 35 30 25 25 20July 16: 28 30 35 48 60 65 50 40 35 25 20 20July 17: 35 42 45 70 72 75 60 45 40 25 25 25a. construct a time series plot. What type of pattern exists in the data?
Chapter 17 Solutions
Modern Business Statistics with Microsoft Office Excel (with XLSTAT Education Edition Printed Access Card) (MindTap Course List)
Ch. 17.2 - 1. Consider the following time series...Ch. 17.2 - 2. Refer to the time series data in exercise 1....Ch. 17.2 - Prob. 3ECh. 17.2 - 4. Consider the following time series...Ch. 17.3 - Consider the following time series...Ch. 17.3 - Consider the following time series...Ch. 17.3 - Refer to the gasoline sales time series data in...Ch. 17.3 - Prob. 8ECh. 17.3 - 9. With the gasoline time series data from Table...Ch. 17.3 - 10. With a smoothing constant of α = .2, equation...
Ch. 17.3 - For the Hawkins Company, the monthly percentages...Ch. 17.3 - Corporate triple-A bond interest rates for 12...Ch. 17.3 - The values of Alabama building contracts (in $...Ch. 17.3 - The following time series shows the sales of a...Ch. 17.3 - Ten weeks of data on the Commodity Futures Index...Ch. 17.3 - Prob. 16ECh. 17.4 - Consider the following time series...Ch. 17.4 - Prob. 18ECh. 17.4 - Prob. 19ECh. 17.4 - Prob. 20ECh. 17.4 - Prob. 21ECh. 17.4 - Prob. 22ECh. 17.4 - The president of a small manufacturing firm is...Ch. 17.4 - The following data shows the average interest rate...Ch. 17.4 - Quarterly revenue ($ millions) for Twitter for the...Ch. 17.4 - Giovanni Food Products produces and sells frozen...Ch. 17.4 - The number of users of Facebook from 2004 through...Ch. 17.5 - Consider the following time series.
Construct a...Ch. 17.5 - Consider the following time series...Ch. 17.5 - The quarterly sales data (number of copies sold)...Ch. 17.5 - Air pollution control specialists in southern...Ch. 17.5 - South Shore Construction builds permanent docks...Ch. 17.5 - Prob. 33ECh. 17.5 - Prob. 34ECh. 17.6 - Consider the following time series...Ch. 17.6 - Refer to exercise 35.
Deseasonalize the time...Ch. 17.6 - The quarterly sales data (number of copies sold)...Ch. 17.6 - Three years of monthly lawn-maintenance expenses...Ch. 17.6 - Air pollution control specialists in southern...Ch. 17.6 - Electric power consumption is measured in...Ch. 17 - The weekly demand (in cases) for a particular...Ch. 17 - The following table reports the percentage of...Ch. 17 - United Dairies, Inc., supplies milk to several...Ch. 17 - Annual retail store revenue for Apple from 2007 to...Ch. 17 - The Mayfair Department Store in Davenport, Iowa,...Ch. 17 - Prob. 47SECh. 17 - The Costello Music Company has been in business...Ch. 17 - Consider the Costello Music Company problem in...Ch. 17 - Prob. 50SECh. 17 - Refer to the Costello Music Company time series in...Ch. 17 - Prob. 52SECh. 17 - Refer to the Hudson Marine problem in exercise 52....Ch. 17 - Refer to the Hudson Marine problem in exercise...Ch. 17 - Refer to the Hudson Marine data in exercise...Ch. 17 - Forecasting Food and Beverage Sales
The Vintage...Ch. 17 - The Carlson Department Store suffered heavy damage...
Knowledge Booster


Learn more about
Need a deep-dive on the concept behind this application? Look no further. Learn more about this topic, statistics and related others by exploring similar questions and additional content below.Similar questions
- Table 6 shows the year and the number ofpeople unemployed in a particular city for several years. Determine whether the trend appears linear. If so, and assuming the trend continues, in what year will the number of unemployed reach 5 people?arrow_forwardair pollution control specialists in southern california monitor the amount of ozone, carbon dioxide, and nitrogen dioxide in the air on an hourly basis. the hourly time series dataexhibit seasonality, with the levels of pollutants showing patterns that vary over the hoursin the day. on july 15, 16, and 17, the following levels of nitrogen dioxide were observedfor the 12 hours from 6:00 a.m. to 6:00 p.m.July 15: 25 28 35 50 60 60 40 35 30 25 25 20July 16: 28 30 35 48 60 65 50 40 35 25 20 20July 17: 35 42 45 70 72 75 60 45 40 25 25 25a. construct a time series plot. What type of pattern exists in the data?b. Use the following dummy variables to develop an estimated regression equation toaccount for the seasonal effects in the data.hour1 = 1 if the reading was made between 6:00 a.m. and 7:00 a.m.;0 otherwisehour2 = 1 if if the reading was made between 7:00 a.m. and 8:00 a.m.;0 otherwise...hour11 = 1 if the reading was made between 4:00 p.m. and 5:00 p.m.,0 otherwise.note that when the…arrow_forwardair pollution control specialists in southern california monitor the amount of ozone, carbon dioxide, and nitrogen dioxide in the air on an hourly basis. the hourly time series dataexhibit seasonality, with the levels of pollutants showing patterns that vary over the hoursin the day. on july 15, 16, and 17, the following levels of nitrogen dioxide were observedfor the 12 hours from 6:00 a.m. to 6:00 p.m.July 15: 25 28 35 50 60 60 40 35 30 25 25 20July 16: 28 30 35 48 60 65 50 40 35 25 20 20July 17: 35 42 45 70 72 75 60 45 40 25 25 25a. construct a time series plot. What type of pattern exists in the data?b. Use the following dummy variables to develop an estimated regression equation toaccount for the seasonal effects in the dataarrow_forward
- air pollution control specialists in southern california monitor the amount of ozone, carbon dioxide, and nitrogen dioxide in the air on an hourly basis. the hourly time series dataexhibit seasonality, with the levels of pollutants showing patterns that vary over the hoursin the day. on july 15, 16, and 17, the following levels of nitrogen dioxide were observedfor the 12 hours from 6:00 a.m. to 6:00 p.m.July 15: 25 28 35 50 60 60 40 35 30 25 25 20July 16: 28 30 35 48 60 65 50 40 35 25 20 20July 17: 35 42 45 70 72 75 60 45 40 25 25 25a. construct a time series plot. What type of pattern exists in the data?arrow_forwardWhich of the following time periods will have the largest annual average increase in the percentage of jobs that could be fully automated (based on the provided images attached)? A) 2020-2028 B) 2028-2030 C) 2030-2035 D) 2035-2040 E) 2040-2050 Transcribed Image Text:Preparing for Automation The possibility of having robots or mechanical assistants completing our laborious, dangerous, or repetitive day-to-day tasks has long been a dream of humanity. Now, as Robotic Process Automation (RPA) becomes commonplace, this dream or concern, depending on viewpoint - is getting closer. RPA, far from the walking, talking android commonly found in science fiction series, can be thought of as a programmable piece of software which, through using a series of rules, will complete repetitive tasks with a lower error rate and less interruption than a human completing the same tasks. The aim of RPA, beyond improving efficiency, is to free up humans from the monotony of roles like data entry, stock…arrow_forwardDemand for haircut at PogiPoints Barber Shop has increased steadily for the past few months as seen in the following time series data. Do the necessary computations and choose the best answer that would complete each statement. The demand forecast for Month 6 would be: * A. 565 haircuts B. 574 haircuts C. 578 haircuts D. 584 haircutsarrow_forward
arrow_back_ios
arrow_forward_ios
Recommended textbooks for you
 Algebra & Trigonometry with Analytic GeometryAlgebraISBN:9781133382119Author:SwokowskiPublisher:Cengage
 College Algebra (MindTap Course List)AlgebraISBN:9781305652231Author:R. David Gustafson, Jeff HughesPublisher:Cengage Learning
 College AlgebraAlgebraISBN:9781305115545Author:James Stewart, Lothar Redlin, Saleem WatsonPublisher:Cengage Learning
 Trigonometry (MindTap Course List)TrigonometryISBN:9781337278461Author:Ron LarsonPublisher:Cengage Learning
Algebra & Trigonometry with Analytic Geometry
Algebra
ISBN:9781133382119
Author:Swokowski
Publisher:Cengage
College Algebra (MindTap Course List)
Algebra
ISBN:9781305652231
Author:R. David Gustafson, Jeff Hughes
Publisher:Cengage Learning
College Algebra
Algebra
ISBN:9781305115545
Author:James Stewart, Lothar Redlin, Saleem Watson
Publisher:Cengage Learning
Trigonometry (MindTap Course List)
Trigonometry
ISBN:9781337278461
Author:Ron Larson
Publisher:Cengage Learning
Time Series Analysis Theory & Uni-variate Forecasting Techniques; Author: Analytics University;https://www.youtube.com/watch?v=_X5q9FYLGxM;License: Standard YouTube License, CC-BY
Operations management 101: Time-series, forecasting introduction; Author: Brandoz Foltz;https://www.youtube.com/watch?v=EaqZP36ool8;License: Standard YouTube License, CC-BY