January February $67,200 $11,520 $38,400 100,000 96,000 April $64,512 $15,667 $36,864 96,000 92,160 March $60,480 $12,960 $34,560 90,000 86,400 May $57,120 $16,320 $32,640 85,000 81,600 June 1 2 Paper stock 3 Coating 4 Conversion cost (incl. energy) 5 Pounds input to the process 6 Pounds transferred out $63,840 $11,856 $36,480 $53,760 $18,432 $30,720 80,000 76,800 95,000 91,200


Process Costing
Process costing is a sort of operation costing which is employed to determine the value of a product at each process or stage of producing process, applicable where goods produced from a series of continuous operations or procedure.
Job Costing
Job costing is adhesive costs of each and every job involved in the production processes. It is an accounting measure. It is a method which determines the cost of specific jobs, which are performed according to the consumer’s specifications. Job costing is possible only in businesses where the production is done as per the customer’s requirement. For example, some customers order to manufacture furniture as per their needs.
ABC Costing
Cost Accounting is a form of managerial accounting that helps the company in assessing the total variable cost so as to compute the cost of production. Cost accounting is generally used by the management so as to ensure better decision-making. In comparison to financial accounting, cost accounting has to follow a set standard ad can be used flexibly by the management as per their needs. The types of Cost Accounting include – Lean Accounting, Standard Costing, Marginal Costing and Activity Based Costing.
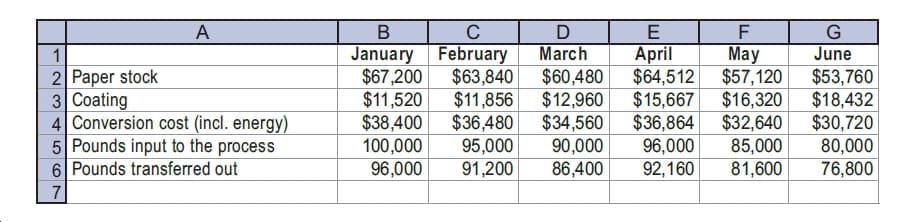
Pix Paper Inc. produces photographic paper for printing digital images. One of the processes for this operation is a coating (solvent spreading) operation, where chemicals are coated onto paper stock. There has been some concern about the cost performance of this operation. As a result, you have begun an investigation. You first discover that all materials and conversion prices have been stable for the last six months. Thus, increases
in prices for inputs are not an explanation for increasing costs. However, you have discovered three possible problems from some of the operating personnel whose quotes follow:
Operator 1: “I’ve been keeping an eye on my operating room instruments. I feel as though our energy consumption is becoming less efficient.”
Operator 2: “Every time the coating machine goes down, we produce waste on shutdown and subsequent startup. It seems as though during the last half year, we have had more unscheduled machine shutdowns than in the past. Thus, I think our yields must be dropping.”
Operator 3: “My sense is that our coating costs are going up. It seems as though we are spreading a thicker coating than we should. Perhaps the coating machine needs to be recalibrated.”
The Coating Department had no beginning or ending inventories for any month during the study period. The following data from the cost of production report are made available:
Attachment
a. Prepare a table showing the paper cost per output pound, coating cost per output pound, conversion cost per output pound, and yield (pounds transferred out/pounds input) for each month. Round costs to the nearest cent and yield to the nearest whole percent.
b. Interpret your table results.


Trending now
This is a popular solution!

Step by step
Solved in 3 steps with 2 images


