
To show:
The graphical representation of
Explanation of Solution
Average Cost function plays a pivotal role in establishing economies and diseconomies of scale.
Before the automation process and the assembly line production, cost of production of an automobile was exorbitant. This is shown in Panel a) of Figure 1. There were only few firms producing automobiles. Hence, their supply was limited. Average total cost of production curve AC shows the cost of Q1 of automobiles to be A1.
This cost reflects the average cost in 1901 when the technique of production to be used was limited and there were unspecialized workers. With assembly line production, division of labor was achieved. Automobile manufacturers were able to use specialized labor for specific activity. This greatly helped them in achieving economic of scale that reduced average cost of production.
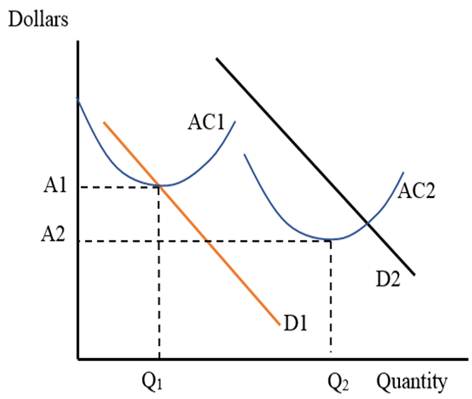
With time, there has been more use of machines that have replaced labor. This has reduced the per vehicle cost further down. This is shown by average total cost of production curve AC that shows the cost of Q2 units of automobiles to be A2 in Figure 1.
The demand curve for automobiles in 1901 was low, shown by D1 in Figure 1.People had limited financial sources to buy an automobile. Hence, they demanded fewer automobiles. With already limited supply of automobiles, the price was quite high.
By 2016, the prices have fallen because cost of production has reduced dramatically. Also, the income levels have increased for most of the consumers. This has increased their willingness to pay. Hence, the demand curve for automobiles in 2016 is higher and is shown as D2 in Figure 1.
Average Total Cost:
Average total cost is expressed as the cost incurred by the firm on the production of one unit of the output, on average. It can be measured from the total cost function when the latter is divided by the number of units produced.
Want to see more full solutions like this?
Chapter 18 Solutions
MyLab Economics with Pearson eText -- Access Card -- for Foundations of Economics

- MelCo’s Xamoff The global pharmaceuticals giant, MelCo, has had great success with Xamoff, and over-thecounter medicine that reduces exam-related anxiety. A patent currently protects Xamoff from competition, although rumors persist that similar products are in development. Two years ago, MelCo sold 25 million units for a price of $10 for a package of ten. Last year it raised the price to $11, and sales fell to 22 million units. Finally, a financial analyst estimates the cost of production at $2 per package. (a) Estimate the elasticity of demand for this product at $10. Is this price too high or too low? (b) Estimate the elasticity of demand for this product at $11. Is this price too high or too low? (c) Based on your answers to (a) and (b), what can we say about MelCo’s profit-maximizing price?arrow_forwardBlue INK is the only cabel service provider in Gazipur. The diagram below depicts the price, output and costs incurred by Blue INK. Use the graph to answer the following questions: What is the Total revenue generated by Blue INK at the profit maximizing level of output?[ Answer in Numerical value only.i;e. 1,2,3,4,5] If the Cable Service Market turns into a Perfectly Competitive Market, what will be the total ammount of the service provided? [ Answer in Numerical value only] If the market turns into a Monopoly market again, what will be the total deadweight loss created? [ Answer in Numerical value only]arrow_forwardThe next 6 questions relate to the following table. Calculate total revenue at a quantity of 5 units. (The table gives you Quantity, Price, and Total Costs, leaving the Total Revenue and Profit for you to calculate.) Quantity Price Total Revenue Total Cost Profit 0 70 0 1 70 60 2 70 120 3 70 180 4 70 300 5 70 410 Calculate profit at an output of 4 units. What is the highest profit possible? What is the profit maximizing level of output What is the profit maximizing price? Can you tell if this is the short run or long run? Explain.arrow_forward
- You decide to create a burger restaurant named BurgerDeals to help pay for college fees. The table below contains total pricing information for your single product, large extra-cheese burger. Your town's burger market is fiercely competitive, with big extra-cheese burger selling for $7 on average. Fill in the blanks in the table and answer the following question. What is AVC if you produce 6 burgers?arrow_forward2. Two cereal firms that set prices and sell differentiated products propose to merge. Firm 1sells CrunchyCrunch for a price of $10 with a marginal cost of $6. Firm 2 sells FibryFibre for aprice of $12 and a marginal cost of $6.(a) When the price of CC rises, 20% of its lost demand goes to FF. What is the marginal costreduction for CC that is required to offset the upwards pricing pressure on the CC price?(b) You are employed as a consultant by the merging firms. You know that the DOJ knowsthat the marginal cost of FF will fall by 50 cents as a result of the merger, but that the agency isunsure of the diversion between FF and CC. How small will you need to claim that the diversionis in order for there to be no net upwards pricing pressure on the CC price?arrow_forwardTammy quit her job as a math teacher making $70,000 per year to start her own online business. The first-year revenue totaled to $200,000. During the first year of online business, Tammy paid $50,000 for the office rent and $20,000 for utilities and supplies. What is the amount of economic profit generated from Tammy’s online business?arrow_forward
- Bavarian Crystal Works designs and produces crystal wine decanters for export to international markets. The marketing manager of Bavarian Crystal Works estimates the demand curve for each month to be: P=1,000-0.0025Q Where Q is the number of wine decanters produced monthly. Bavarian Crystal Works also pays a lease for its factory and equipment every month in the amount of $1,000,000. Finally, the cost to produce each wine decanter is $200. What quantity would maximize profits? What is the optimal price for Bavarian Crystals to charge?arrow_forwardPlease solve Fast i give 2 like Which of the following is not true according to Figure 1? Hide Transcribed Text Figure 1: Cost and Price AC : Average Cost, AVC: Average Variable Cost, and MC: Marginal Cost A) The firm earn a zero economic profit when it produces 40 unit at the price of $5.7 per unit. B) The minimum acceptable price (the shut-down point) is $4.3 per unit. C) The firm's supply curve is its MC curve above minimum of AVC. D) The firm earns an economic profit when the price exceeds $4.3 per unit.arrow_forwardYou decide to create a burger restaurant named BurgerDeals to help pay for college fees. The table below contains total pricing information for your single product, large extra-cheese burger. Your town's burger market is fiercely competitive, with big extra-cheese burger selling for $7 on average. Fill in the blanks in the table and answer the following question. What is BurgerDeals TFC?arrow_forward
- The following table shows the demand and supply for a popular pair of shoes sold by Akron Enterprise Limited (AEL). Price per pair $ Qty. Demanded Quantity supplied Market condition Presure on price 105 25000 75000 surplus downward 90 30000 70000 surplus downward 75 40000 60000 surplus downward 60 50000 50000 equilibrium No pressure 45 60000 35000 shortage upward 30 80000 20000 shortage upward 15 100000 5000 shortage upward Other information regarding AEL are as follows: Fixed cost = $2000 Variable Cost = 20Q Question 1 a. Graphically illustrate market equilibrium using the information in the above table. b. Explain and graphically illustrate a price floor implemented by the government using an appropriate price in the table above. c. If Akron Enterprise Limited sells its products at equilibrium price, calculate total revenue and total profit. d. At what level of price(s) identified above is a shut-down price for Akron Enterprise Limited. e. Graphically illustrate…arrow_forwardIn a grocery store, shelf space is limited and must be used effectively to increase profit. Two cereal items, FL and KC, compete for total shelf space of 60 square feet. A box of FL occupies 0.2 ft2 and a box of KC needs 0.4 ft2. The maximum daily demands of FL and KC are 200 and 120 boxes, respectively. A box of FL nets PhP 10 in profit and a box of KC PhP 13.50. The owner of the grocery thinks that because the unit profit of KC is 35% higher than that of FL, KC should also be allocated 35% more space than FL, which amounts to allocating about 57% to KC and 43% to FL. What do you think?arrow_forwardPlease assist with questions 3 (i) and (ii) (3) You are an accountant for a manufacturer of radios. The demand function for the tablets is 2 p x = 40-4x2 where x is the number of tablets produced in millions. It costs the company $15 to make a tablet. (i). Write an equation for the manufacturer’s profit as a function of the number of tablets produced. (ii). The company currently produces 1 million 2tablets and makes a profit of $21,000,000, but you would like to scale up production a bit. What greater number of tablets could the company produce to yield the same profit?arrow_forward

 Principles of MicroeconomicsEconomicsISBN:9781305156050Author:N. Gregory MankiwPublisher:Cengage Learning