
Concept explainers
Videos
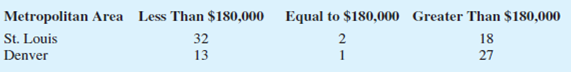
Due to a recent decline in the housing market, the national median sales price for single-family homes is $180,000 (The National Association of Realtors, January 2009). Assume that the following data were obtained from samples of recent sales of single-family homes in St. Louis and Denver.
- a. Is the median sales price in St. Louis significantly lower than the national median of $180,000? Use a statistical test with α = .05 to support your conclusion.
- b. Is the median sales price in Denver significantly higher than the national median of $180,000? Use a statistical test with α = .05 to support your conclusion.
a.
Check whether the median sales price in St. Louis is significantly lower than the national median of $180,000 or not.
Answer to Problem 39SE
The median sale price for single-family homes in St. Louis is less than the national median price of $180,000.
Explanation of Solution
Calculation:
The given information is that the national median sales price for single family home is $180,000. The level of significance is 0.05.
The hypotheses are given below:
Null hypothesis:
That is, the median sales price in St. Louis is significantly greater than or equal to the national median of $180,000.
Alternative hypothesis:
That is, the median sales price in St. Louis is significantly lower than the national median of $180,000.
For a sign test, the mean
The mean is,
Thus, the mean is 25.
The standard deviation is,
Thus, the standard deviation is 3.5355.
There are 18 plus signs in the lower tail.
The probability of 18 plus signs in the lower tail can be obtained by using the continuity correction factor and normal approximation. Hence, the p-value is obtained by using normal distribution with
Procedure:
Step by step procedure to obtain the above probability using Table 1 of Appendix B is given below:
- Locate the value –1.8 in the column, named z.
- Move towards the right along the row of –1.8, till the column named 0.04 is reached.
- The cell at the intersection of the row –1.8 and the column 0.04 gives the cumulative probability corresponding to the standard normal variable value –1.84.
Thus,
Now,
Rejection rule:
If
Conclusion:
Here the level of significance
Here,
That is, p-value is less than significance level.
Therefore, the null hypothesis is rejected.
Hence, it can be concluded that the median sale price for single-family homes in St. Louis is less than the national median price of $180,000.
b.
Check whether the median sales price in Denver is significantly higher than the national median of $180,000 or not.
Answer to Problem 39SE
The median sale price for single-family homes in Denver is greater than the national median price of $180,000.
Explanation of Solution
Calculation:
The hypotheses are given below:
Null hypothesis:
That is, the median is less than or equal to 180,000.
Alternative hypothesis:
That is, median is greater than 180,000.
There are
For a sign test, the mean
The mean is,
Thus, the mean is 20.
The standard deviation is,
Thus, the standard deviation is 3.1623.
There 27 plus signs in the upper tail.
The probability of 27 plus signs in the upper tail can be obtained by using the continuity correction factor and normal approximation. Hence, the p-value is obtained by using normal distribution with
Procedure:
Step by step procedure to obtain the above probability using Table 1 of Appendix B is given below:
- Locate the value 2.0 in the column, named z.
- Move towards the right along the row of 2.0, till the column named 0.06 is reached.
- The cell at the intersection of the row 2.0 and the column 0.06 gives the cumulative probability corresponding to the standard normal variable value 2.06.
Thus,
Therefore,
The upper-tail p-value is 0.0197.
Rejection rule:
If
Conclusion:
Here the level of significance
Here,
That is, p-value is less than significance level.
Therefore, the null hypothesis is rejected.
Hence, it can be concluded that the median sale price for single-family homes in Denver is greater than the national median price of $180,000.
Want to see more full solutions like this?
Chapter 18 Solutions
Statistics for Business & Economics, Revised (MindTap Course List)


 Glencoe Algebra 1, Student Edition, 9780079039897...AlgebraISBN:9780079039897Author:CarterPublisher:McGraw Hill