
Modern Business Statistics with Microsoft Office Excel (with XLSTAT Education Edition Printed Access Card) (MindTap Course List)
6th Edition
ISBN: 9781337115186
Author: David R. Anderson, Dennis J. Sweeney, Thomas A. Williams, Jeffrey D. Camm, James J. Cochran
Publisher: Cengage Learning
expand_more
expand_more
format_list_bulleted
Concept explainers
Videos
Textbook Question
Chapter 18.4, Problem 26E
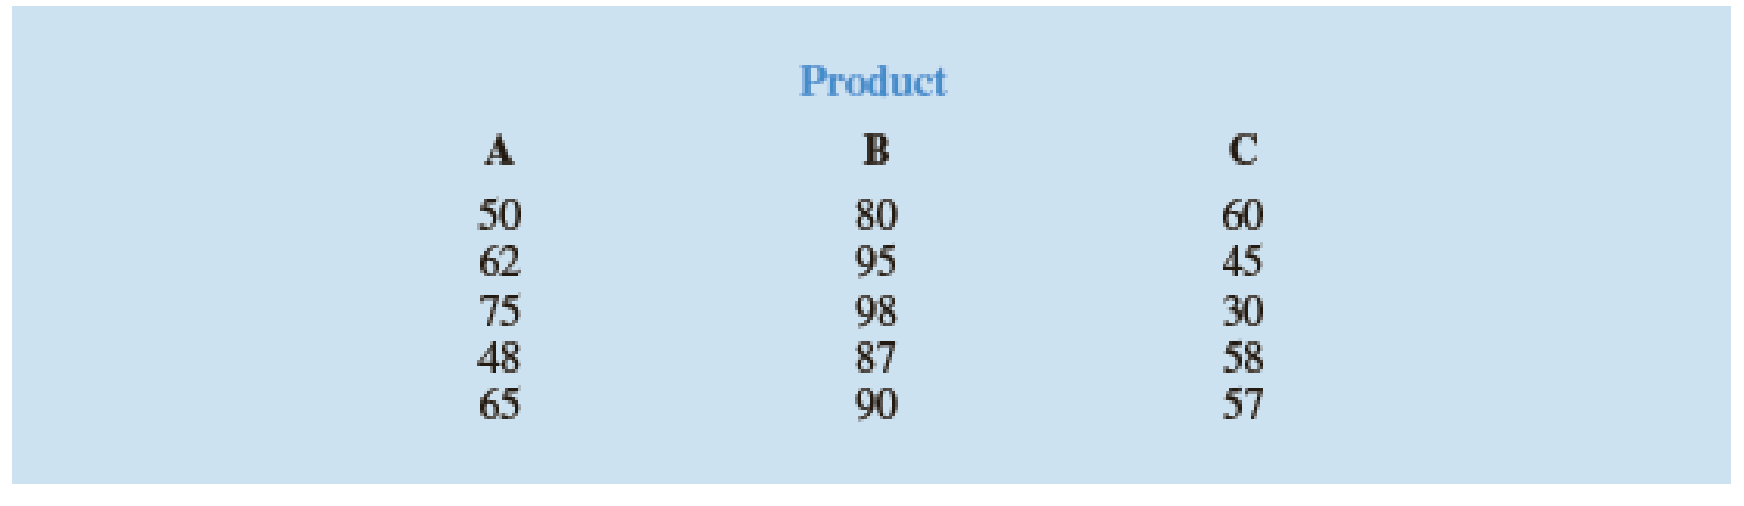
A sample of 15 consumers provided the following product ratings for three different products. Five consumers were randomly assigned to test and rate each product. Use the Kruskal–Wallis test and α = .05 to determine whether there is a significant difference among the ratings for the products.
Expert Solution & Answer

Trending nowThis is a popular solution!

Students have asked these similar questions
Which New Jersey universities have students with higher GPAs? A researcher compares the GPA of 20 randomly selected students from each of the following 3 schools: Seton Hall, TCNJ, and Rowan. The mean GPAs were as follows: Seton Hall = 3.12, TCNJ = 3.39, Rowan = 2.90. (These are all made up, by the way.) SSwithin = 18.39 and SSbetween = 2.24. What can the researcher conclude at alpha .05?
A group of high-risk automobile drivers (with three moving violations in one year) are required, according to random assignment, either to attend a traffic school or to perform supervised volunteer work. During the subsequent five-year period, these same drivers were cited for the following number of moving violations:
NUMBER OF MOVING VIOLATIONS
TRAFFIC SCHOOL VOLUNTEER WORK
0 26
0 7
15 4
9 1
7 1
0 14
2 6
23 10
7
8
Why might the Mann–Whitney U test be preferred to the t test for these data?
Use U to test the null hypothesis at the .05 level of significance.
Specify the approximate p-value for this test result.
.A sample of 9 measurements, randomly selected from a normally distributed population,
resulted in x= 2.6, and s= 0.9 Conduct a hypothesis test to verify the claim that the
population mean is greater than 2.5 . Use a=.05
Chapter 18 Solutions
Modern Business Statistics with Microsoft Office Excel (with XLSTAT Education Edition Printed Access Card) (MindTap Course List)
Ch. 18.1 - 1. The following hypothesis test is to be...Ch. 18.1 - 2. Ten individuals participated in a taste test...Ch. 18.1 - 3. The median number of part-time employees at...Ch. 18.1 - 4. Net assets for the 50 largest stock mutual...Ch. 18.1 - Prob. 5ECh. 18.1 - Prob. 6ECh. 18.1 - Prob. 7ECh. 18.1 - Prob. 8ECh. 18.1 - Prob. 9ECh. 18.1 - Prob. 10E
Ch. 18.1 - Prob. 11ECh. 18.2 - 12. Two fuel additives are tested to determine...Ch. 18.2 - 13. A sample of 10 men was used in a study to test...Ch. 18.2 - Prob. 14ECh. 18.2 - Prob. 15ECh. 18.2 - Prob. 16ECh. 18.2 - Prob. 17ECh. 18.3 - Two fuel additives are being tested to determine...Ch. 18.3 - Samples of starting annual salaries for...Ch. 18.3 - The gap between the earnings of men and women with...Ch. 18.3 - Prob. 21ECh. 18.3 - Prob. 22ECh. 18.3 - Police records show the following numbers of daily...Ch. 18.3 - A certain brand of microwave oven was priced at 10...Ch. 18.3 - Prob. 25ECh. 18.4 - A sample of 15 consumers provided the following...Ch. 18.4 - Three admission test preparation programs are...Ch. 18.4 - Prob. 28ECh. 18.4 - Prob. 29ECh. 18.4 - A large corporation sends many of its first-level...Ch. 18.4 - Prob. 31ECh. 18.5 - Prob. 32ECh. 18.5 - 33. Consider the following two sets of rankings...Ch. 18.5 - Prob. 34ECh. 18.5 - Prob. 35ECh. 18.5 - 36. The rankings of a sample of professional...Ch. 18.5 - Prob. 37ECh. 18 - 38. A survey asked the following question: Do you...Ch. 18 - Prob. 39SECh. 18 - Prob. 40SECh. 18 - Prob. 41SECh. 18 - Prob. 42SECh. 18 - Prob. 43SECh. 18 - Prob. 44SECh. 18 - Prob. 45SECh. 18 - Prob. 46SECh. 18 - Prob. 47SE
Knowledge Booster


Learn more about
Need a deep-dive on the concept behind this application? Look no further. Learn more about this topic, statistics and related others by exploring similar questions and additional content below.Similar questions
- The manufacturer of a popular soft drink claims that cans of this drink contain 12 ounces. A consumer group is suspicious of this claim and believes the amount in each can is less than 12 ounces. A random sample of 18 cans is selected and the amount in each can is measured. The results are as follows: 11.9 11.9 12.0 11.9 12.0 11.7 11.6 11.5 11.6 12.0 11.8 11.7 12.2 11.5 12.1 11.8 12.1 11.8 State the number of degrees of freedom (d.f.) that will be used to test the null hypothesis.______________arrow_forwarda researcher uses a sample of n=25 individuals to evaluate the effect of a treatment. the hypothesis test uses a=0.05 and produces a significant result with t=2.15. how would this result be reported in the literature?arrow_forward
Recommended textbooks for you
 Algebra & Trigonometry with Analytic GeometryAlgebraISBN:9781133382119Author:SwokowskiPublisher:Cengage
 Holt Mcdougal Larson Pre-algebra: Student Edition...AlgebraISBN:9780547587776Author:HOLT MCDOUGALPublisher:HOLT MCDOUGAL
Algebra & Trigonometry with Analytic Geometry
Algebra
ISBN:9781133382119
Author:Swokowski
Publisher:Cengage
Holt Mcdougal Larson Pre-algebra: Student Edition...
Algebra
ISBN:9780547587776
Author:HOLT MCDOUGAL
Publisher:HOLT MCDOUGAL
Correlation Vs Regression: Difference Between them with definition & Comparison Chart; Author: Key Differences;https://www.youtube.com/watch?v=Ou2QGSJVd0U;License: Standard YouTube License, CC-BY
Correlation and Regression: Concepts with Illustrative examples; Author: LEARN & APPLY : Lean and Six Sigma;https://www.youtube.com/watch?v=xTpHD5WLuoA;License: Standard YouTube License, CC-BY