
Concept explainers
Videos
The scores of a test for an engineering class of 30 students are shown here. Organize the data in a manner similar to Table 19.1 and use Excel to create a histogram.
Scores: 57, 94, 81, 77, 66, 97, 62, 86, 75, 87, 91, 78, 61, 82, 74, 72, 70, 88, 66, 75, 55, 66, 58, 73, 79, 51, 63, 77, 52, 84
Create a histogram for the test scores of an engineering class students using Excel.
Explanation of Solution
Given data:
Number of students,
Students test scores are 57, 94, 81, 77, 66, 97, 62, 86, 75, 87, 91, 78, 61, 82, 74, 72, 70, 88, 66, 75, 55, 66, 58, 73, 79, 51, 63, 77, 52, 84.
Calculation:
The given test scores are organized in a grouped frequency distribution manner which is shown in Table 1. In the distribution, the frequency represents the number of test scores in a given range.
Table 1
| Scores | Range | Frequency |
| 57, 55, 58, 51, 52 | 50-59 | 5 |
| 66, 62, 61, 66, 66, 63 | 60-69 | 6 |
| 77, 75, 78, 74, 72, 70, 75, 73, 79, 77 | 70-79 | 10 |
| 81, 86, 87, 82, 88, 84 | 80-89 | 6 |
| 94, 97, 91 | 90-99 | 3 |
Draw the histogram for the students test scores for the respective frequency
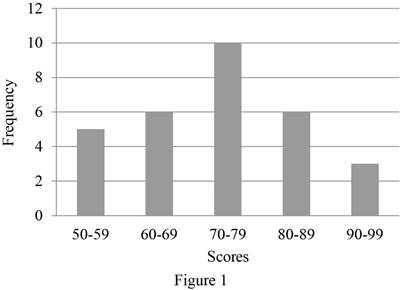
Therefore, the histogram for the test scores of engineering class students is shown in Figure 1.
Conclusion:
Thus, the histogram for the test scores of an engineering class students has been created using Excel.
Want to see more full solutions like this?
Chapter 19 Solutions
Engineering Fundamentals: An Introduction to Engineering (MindTap Course List)


- You are to write down on a piece of paper the number of credits you are taking this semester. Your instructor will then collect the data and share the results with the class. Calculate the mean and standard deviation of the data. Assuming a normal distribution, determine the probability that a student is taking between 12 to 15 credits this semester. What is the probability that a student is taking less than 12 credits?arrow_forwardImagine that you and four of your classmates have measured the density of air and recorded the values shown in the accompanying table. Determine the average, variance, and standard deviation for the measured density of air. Density of Air (kg/m3) 1.27 1.21 1.28 1.25 1.24arrow_forwardLet 4 items be chosen at random from a lot containing 12 items of which 5 are defective. Determine the probability that at most 3 items are defective. 92/99 98/99 86/91 5/91arrow_forward
- The next time you make a trip to a supermarket, ask the manager if you can measure the mass of at least 10 cereal boxes of your choice. Choose the same brand and the same size boxes. Tell the manager this is an assignment for a class. Report the average mass, variance, and standard deviation for the cereal boxes. Does the manufacturer’s information noted on the box fall within your measurement? Repeat Problem using three other products, such as cans of soup, tuna, or peanuts.arrow_forwardThe next time you make a trip to a supermarket, ask the manager if you can measure the mass of at least 10 cereal boxes of your choice. Choose the same brand and the same size boxes. Tell the manager this is an assignment for a class. Report the average mass, variance, and standard deviation for the cereal boxes. Does the manufacturer’s information noted on the box fall within your measurement?arrow_forwardAnalyze each statement (A and B) whether they are true or false. Use the choices below in answering each item; A statement A is true B statement B is true C both A and B are true D neither A nor B are true (A) Below 19.4 oC, hydrometer reading increases (B) Above 19.4 oC, hydrometer reading decreases 10.arrow_forward
- A person by the name of Sutterland has developed a correlation that can be used to evaluate the viscosity of air as a function of temperature. It is given by Create a table that shows the viscosity of airas a function of temperature in the range of 0° C (273 15 ) to 100° C (373 15 )in increments of 5° C. Also create a graph showing the value of viscosity as afunction of temperature as shown in the accompanying spreadsheet.arrow_forwardThe number of hours of computer usage in a day of a random sample of 12 students was recorded as follows: 4.7, 3.9, 4.7, 4.8, 5.7, 6.1, 5.7, 5.3, 4.1, 3.1, 3.7, 4.0 What is the standard deviation of the number of hours of computer usage?arrow_forwardSuppose you have purchased a filling machine for candy bags that is supposed to fill each bag with 16 oz of candy. Assume that the weights of filled bags are approximately normally distributed. A random sample of 10 bags yields the following data (in oz): 15.87 16.02 15.78 15.83 15.69 15.81 16.04 15.81 15.92 16.10 On the basis of these data, can you conclude that the mean fill weight is actually less than 16 oz? State the appropriate null and alternate hypotheses. Compute the value of the test statistic. Find the P-value and state your conclusion.arrow_forward
- Sketch a drawing and use the standard normal distribution table to answer the following questions: Given a normal distribution with μ = 30 and σ = 6, find a. the value of x that has 70% of the normal curve area to the left; b. the normal curve area to the left of x = 12; c. the normal curve area between x = 22 and x = 38; d. the two values of x that contain the middle 70% of the normal curve area e. the normal curve area to the right of x = 15;arrow_forwardA Civil engineering student is taking Calculus 2 and Engineering Data Analysis courses. The probability that he will pass Calculus 2 and Engineering Data Analysis is 2/3 and 4/9, respectively. What is the probability that he will pass both courses if the probability of passing at least one course is 4/5.arrow_forwardSketch a drawing and use the standard normal distribution table to answer the following questions: The heights of 1000 students are normally distributed with a mean of 174.5 centimeters and a standard deviation of 6.9 centimeters. Assuming that the heights are recorded to the nearest half-centimeter, how many of these students would you expect to have heights a. less than 150.0 centimeters? b. greater than or equal to 178.0 centimeters? c. greater than or equal to 178.0 centimeters? d. between 161.5 and 192.0 centimeters inclusive?arrow_forward
 Engineering Fundamentals: An Introduction to Engi...Civil EngineeringISBN:9781305084766Author:Saeed MoaveniPublisher:Cengage Learning