
a)
To Analyze: The effect, on the exchange rate between yen and dollar when Japan opens domestic market to more foreign competition, by using supply-and-demand diagrams.
a)
Answer to Problem 1TY
The exchange rate for American dollars increases when Japan opens domestic market to more number of foreign countries.
Explanation of Solution
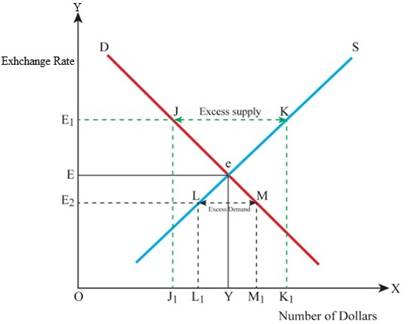
The below mentioned diagram shows the exchange rate being determined based on the supply of dollars in the foreign exchange market.

In the above mentioned graph the
At the point e, the demand for dollar becomes equal to the supply of dollars, and this point is considered as the equilibrium point. For the dollar at Y, the exchange rate will be E. The supply of dollar is K, for the demand for dollar j, and the excess of dollar supply will cause decrease in the value of dollar, subsequent decrease in the exchange rate from
When Japan opens its domestic market to foreign countries, the import also increases, causing an increase in the demand for American dollars in the foreign exchange market. The value of dollar will be appreciated with increase in its demand, thus increasing the exchange rate.
b)
To Analyze: The effect, on the exchange rate between yen and dollar when the value in Tokyo stock market is believed to be falling, by the investors using the supply-and-demand diagrams.
b)
Answer to Problem 1TY
As there is an outflow of funds in order to invest in American Stock Exchange, there will be an increase in the exchange rate also.
Explanation of Solution
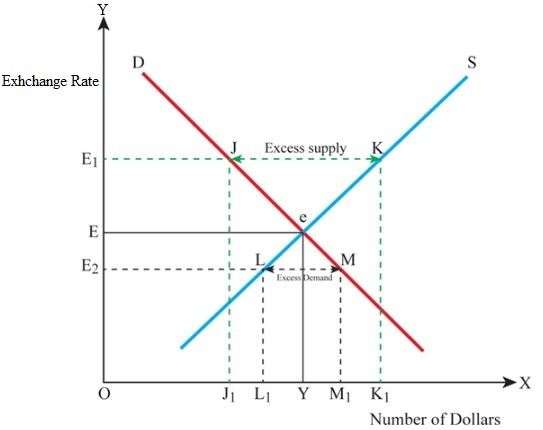
The below mentioned diagram shows the exchange rate being determined based on the supply of dollars in the foreign exchange market.

In the above mentioned graph the
At the point e, the demand for dollar becomes equal to the supply of dollars, and this point is considered as the equilibrium point. For the dollar at Y, the exchange rate will be E. The supply of dollar is K, for the demand for dollar j, and the excess of dollar supply will cause a decrease in the value of dollar, subsequently resulting in a decrease in the exchange rate from
When the investors feel that the value in Tokyo Stock Market is falling, they will start diverting their investments in to American Stock Market. Thus, there will be a capital outflow from Japan to America, which in turn will increase the demand for American dollars in the foreign exchange and the value of dollar also increases. Subsequently there will be an increase in the exchange rate.
c)
To Analyze: The effect, on the exchange rate between yen and dollar when the interest rates are cut by FR in United States, by using supply-and-demand diagrams.
c)
Answer to Problem 1TY
When there is a cut in interest rates by FR, the value of yen increases in foreign exchange and the exchange rate of dollar decreases.
Explanation of Solution
The below mentioned diagram shows the exchange rate being determined based on the supply of dollars in the foreign exchange market.

In the above mentioned graph the
At the point e, the demand for dollar becomes equal to the supply of dollars, and this point is considered as the equilibrium point. For the dollar at Y, the exchange rate will be E. The supply of dollar is K, for the demand for dollar j, and the excess of dollar supply will cause decrease in the value of dollar, subsequently causing a decrease in the exchange rate from
As there is a cut in interest rates in FR, investors will be attracted to higher interest rates being offered by Japan and starts diverting their investments to Japan. Thus the demand for Japanese Yen becomes more in the foreign exchange market, increasing the value of yen against that of dollar, thus decreasing the exchange rate of dollar.
d)
To Analyze: The effect, on the exchange rate between yen and dollar, when huge amounts of foreign aid is given to Israel and her Arab neighbors, by the United States, in order to settle problems in Middle East, by using supply-and-demand diagrams.
d)
Answer to Problem 1TY
When United States gives huge sum of money for settling problems in Middle East, the value of dollar decreases and hence its exchange rate also decreases.
Explanation of Solution
The below mentioned diagram shows the exchange rate being determined based on the supply of dollars in the foreign exchange market.
In the above mentioned graph the
At the point e, the demand for dollar becomes equal to the supply of dollars, and this point is considered as the equilibrium point. For the dollar at Y, the exchange rate will be E. The supply of dollar is K, for the demand for dollar j, and the excess of dollar supply will cause a decrease in the value of dollar, subsequently resulting in a decrease in the exchange rate from
When huge amounts of aid is given to Israel and her neighbors to settle problems in Middle East, there will be an increase in supply of dollars in to the foreign exchange market, which in turn decreases the value of dollar thus decreasing its exchange rate.
e)
To Analyze: The effect, on the exchange rate between yen and dollar, when there is recession in United States and boom in Japan, by using supply-and-demand diagrams.
e)
Answer to Problem 1TY
When there is recession in United States, the value of dollar increases thereby increasing its exchange rate.
Explanation of Solution
The below mentioned diagram shows the exchange rate being determined based on the supply of dollars in the foreign exchange market.

In the above mentioned graph the
At the point e, the demand for dollar becomes equal to the supply of dollars, and this point is considered as the equilibrium point. For the dollar at Y, the exchange rate will be E. The supply of dollar is K, for the demand for dollar j, and the excess of dollar supply will cause a decrease in the value of dollar, subsequently causing a decrease in the exchange rate from
When there is recession in United States, its imports decreases and export increases, and when there is a boom in Japan, its imports increases and export decreases. Thus the demand for Yen by United States decreases, while the demand for dollar by Japan increases, increasing the value of dollar, and thereby increase in its exchange rate.
f)
To Analyze: The effect, on the exchange rate between yen and dollar, when inflation in United States exceeds than that in Japan, by using supply-and-demand diagrams.
f)
Answer to Problem 1TY
When there is inflation in the United States more than that in Japan, then the value of dollar decreases, thereby decreasing its exchange rate.
Explanation of Solution
The below mentioned diagram shows the exchange rate being determined based on the supply of dollars in the foreign exchange market.
In the above mentioned graph the
At the point e, the demand for dollar becomes equal to the supply of dollars, and this point is considered as the equilibrium point. For the dollar at Y, the exchange rate will be E. The supply of dollar is K, for the demand for dollar j, and the excess of dollar supply will cause decrease in the value of dollar, subsequently resulting in decrease in the exchange rate from
When there is inflation in United States than that of Japan, the imports in United States increases, which increases the supply of dollars in foreign exchange market. This decreases the value of dollar, thereby decreasing its exchange rate.
Want to see more full solutions like this?

- List some advantages and disadvantages of the different exchange rate policies.arrow_forwardDo you think that a country experiencing hyperinflation is more or less likely to have an exchange rate equal to its purchasing power parity value when compared to a country with a low inflation rate?arrow_forward


 Economics (MindTap Course List)EconomicsISBN:9781337617383Author:Roger A. ArnoldPublisher:Cengage Learning
 Macroeconomics: Private and Public Choice (MindTa...EconomicsISBN:9781305506756Author:James D. Gwartney, Richard L. Stroup, Russell S. Sobel, David A. MacphersonPublisher:Cengage Learning
 Economics: Private and Public Choice (MindTap Cou...EconomicsISBN:9781305506725Author:James D. Gwartney, Richard L. Stroup, Russell S. Sobel, David A. MacphersonPublisher:Cengage Learning