
Concept explainers
Videos
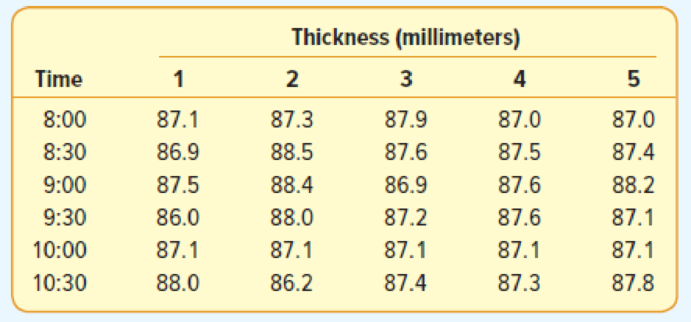
A new machine has just been installed to produce printed circuit boards. One of the critical measurements is the thickness of the resistance layer. The quality control inspector randomly selects five boards each half-hour, measures the thickness, and records the results. The measurements (in millimeters) for the period 8:00 a.m. to 10:30 a.m. follow.
- a. Determine the control limits for the mean and the
range . - b. Plot the control limits for the mean outside diameter and the range.
- c. Are there any points on the mean or the range chart that are out of control? Comment on the chart.
a.
Find the control limits for the mean.
Find the control limits for the range.
Answer to Problem 22CE
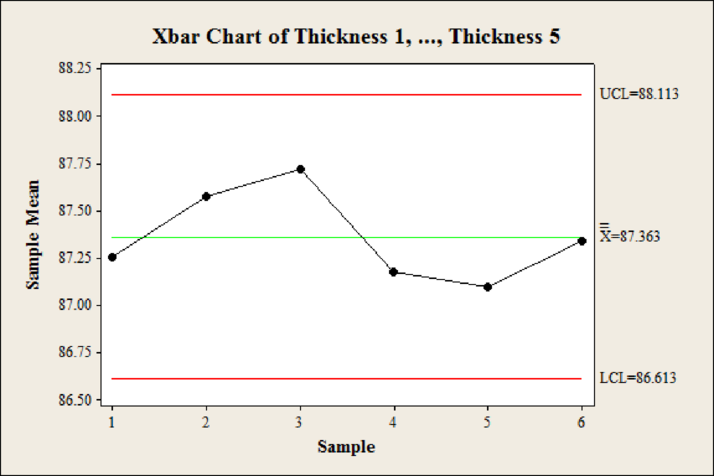
The control limits for the mean is 86.61, and 88.11.
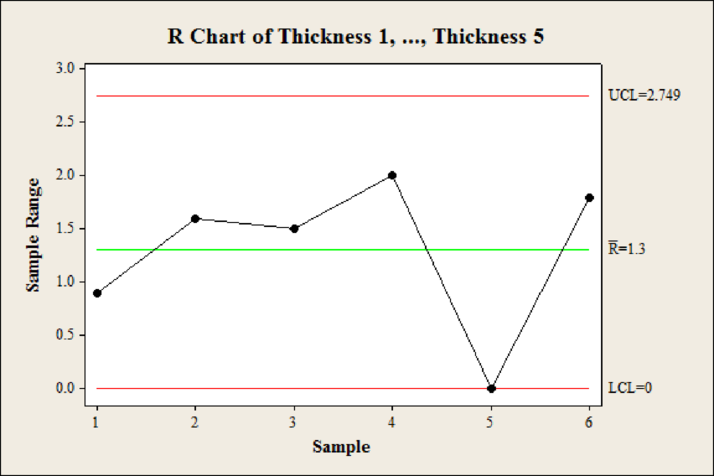
The control limits for the range is 0, and 2.75.
Explanation of Solution
Calculation:
The mean of the sample means is,
Here,
The formula for the control limits is,
Here,
The mean of the sample ranges is,
Here, R denotes the sum of sample ranges, and k denotes the number of sample means.
The formula for the control limits is,
Here,
The sample means are ranges are obtained below:
| Time | Thickness (millimeters) | |||||||
| 1 | 2 | 3 | 4 | 5 | Total | Average | Range | |
| 8:00 | 87.1 | 87.3 | 87.9 | 87.0 | 87.0 | 436.3 | 87.26 | 0.9 |
| 8:30 | 86.9 | 88.5 | 87.6 | 87.5 | 87.4 | 437.9 | 87.58 | 1.6 |
| 9:00 | 87.5 | 88.4 | 86.9 | 87.6 | 88.2 | 438.6 | 87.72 | 1.5 |
| 9:30 | 86.0 | 88.0 | 87.2 | 87.6 | 87.1 | 435.9 | 87.18 | 2 |
| 10:00 | 87.1 | 87.1 | 87.1 | 87.1 | 87.1 | 435.5 | 87.1 | 0 |
| 10:30 | 88.0 | 86.2 | 87.4 | 87.3 | 87.8 | 436.7 | 87.34 | 1.8 |
| Totals | 524.18 | 7.8 | ||||||
The mean of the sample means is,
Hence, the mean of the sample means is 87.36.
The mean of the sample ranges is,
Hence, the mean of the sample ranges it as 1.3.
Compute the value of
From the Appendix B: Tables B.10 Factors for Control Charts:
- Locate the value
- Locate the value 5 in n column.
- The intersecting value is 0.577.
The control limits for the mean is,
Hence, the control limits for the mean is 86.61, and 88.11.
Compute the values of
From the Appendix B: Tables B.10 Factors for Control Charts:
- Locate the value
- Locate the value 5 in n column.
- The intersecting value is 0.
- Locate the value
- Locate the value 5 in n column.
- The intersecting value is 2.115.
The control limits for the range is,
Hence, the control limits for the range is 0, and 2.75.
b.
Construct the control limits for the mean.
Construct the control limits for the range.
Answer to Problem 22CE
Output using MINITAB software is given below:
Explanation of Solution
Calculation:
Step by step procedure to obtain
- Choose Stat > Control Charts > Variables charts for subgroups > Xbar Chart.
- Select option Observations for a subgroup are in one row of columns.
- Enter the column Thickness 1, Thickness 2, Thickness 3, Thickness 4, and Thickness 5.
- Choose Xbar Options.
- In Estimate, select Rbar under Method for estimating standard deviation.
- Click OK.
Step by step procedure to obtain R chart using MINITAB software is given as,
- Choose Stat > Control Charts > Variables charts for subgroups > R Chart.
- Select option Observations for a subgroup are in one row of columns.
- Enter the column Thickness 1, Thickness 2, Thickness 3, Thickness 4, and Thickness 5.
- Choose R Options.
- In Estimate, select Rbar under Method for estimating standard deviation.
- Click OK.
c.
Check whether there any points on the mean or the range chart that are out of control.
Answer to Problem 22CE
The points are within the control.
Explanation of Solution
Calculation:
For
The limits are 86.61 to 88.11 any value beyond this limits is considered as outlier.
In the chart no values are outside the limits this indicates that the process is in the control which implies that none of values are out of control.
For R chart:
The limits are 0 to 2.75 any value beyond this limits is considered as outlier.
In the chart no values are outside the limits this indicates that the process is in the control which implies that none of values are out of control.
Want to see more full solutions like this?
Chapter 19 Solutions
EBK STATISTICAL TECHNIQUES IN BUSINESS


 Mathematics For Machine TechnologyAdvanced MathISBN:9781337798310Author:Peterson, John.Publisher:Cengage Learning,
 Glencoe Algebra 1, Student Edition, 9780079039897...AlgebraISBN:9780079039897Author:CarterPublisher:McGraw Hill
 Big Ideas Math A Bridge To Success Algebra 1: Stu...AlgebraISBN:9781680331141Author:HOUGHTON MIFFLIN HARCOURTPublisher:Houghton Mifflin Harcourt