
Concept explainers
Videos
A process engineer is considering two sampling plans. In the first, a sample of 10 will be selected and the lot accepted if 3 or fewer are found defective. In the second, the sample size is 20 and the acceptance number is 5. Develop an OC curve for each. Compare the
Develop the OC curve for each to compare the probability of acceptance for lots that are 5, 10, 20, and 30% defective.
Explain which of the plans would be recommend if you were the supplier.
Answer to Problem 31CE
Output using MINITAB software is given below:
Explanation of Solution
Calculation:
Let x denotes the accepting lots.
First sampling plan:
For 5% defective:
The probability of accepting lots that is 5% defective is,
Compute the probability value for x less than or equal to 3 using MINITAB.
Step by step procedure to obtain probability using MINITAB software is given as,
- Choose Calc > Probability Distributions > Binomial Distribution.
- Choose Cumulative probability.
- Enter Number of trials as 10 and Event probability as 0.05.
- In Input constant, enter 3.
- Click OK.
Output using MINITAB software is given below:
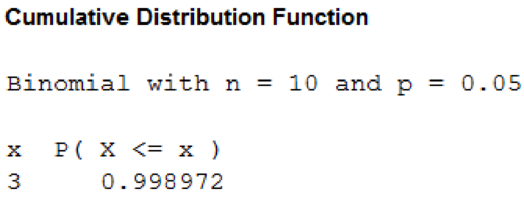
From the MINITAB output, the probability value is 0.999. That is,
For 10% defective:
The probability of accepting lots that is 10% defective is,
Compute the probability value for x less than or equal to 3 using MINITAB.
Step by step procedure to obtain probability using MINITAB software is given as,
- Choose Calc > Probability Distributions > Binomial Distribution.
- Choose Cumulative probability.
- Enter Number of trials as 10 and Event probability as 0.10.
- In Input constant, enter 3.
- Click OK.
Output using MINITAB software is given below:
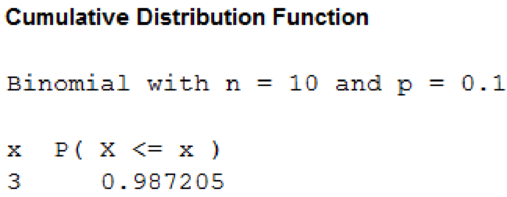
From the MINITAB output, the probability value is 0.987. That is,
For 20% defective:
The probability of accepting lots that is 20% defective is,
Compute the probability value for x less than or equal to 3 using MINITAB.
Step by step procedure to obtain probability using MINITAB software is given as,
- Choose Calc > Probability Distributions > Binomial Distribution.
- Choose Cumulative probability.
- Enter Number of trials as 10 and Event probability as 0.20.
- In Input constant, enter 3.
- Click OK.
Output using MINITAB software is given below:
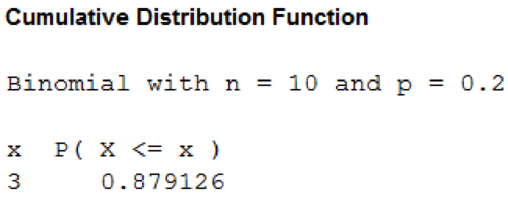
From the MINITAB output, the probability value is 0.879. That is,
For 30% defective:
The probability of accepting lots that is 30% defective is,
Compute the probability value for x less than or equal to 3 using MINITAB.
Step by step procedure to obtain probability using MINITAB software is given as,
- Choose Calc > Probability Distributions > Binomial Distribution.
- Choose Cumulative probability.
- Enter Number of trials as 10 and Event probability as 0.30.
- In Input constant, enter 3.
- Click OK.
Output using MINITAB software is given below:
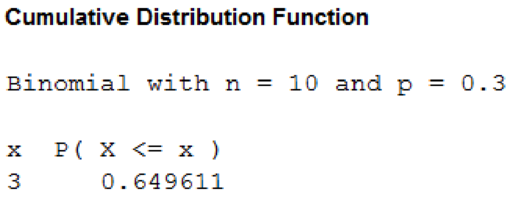
From the MINITAB output, the probability value is 0.649. That is,
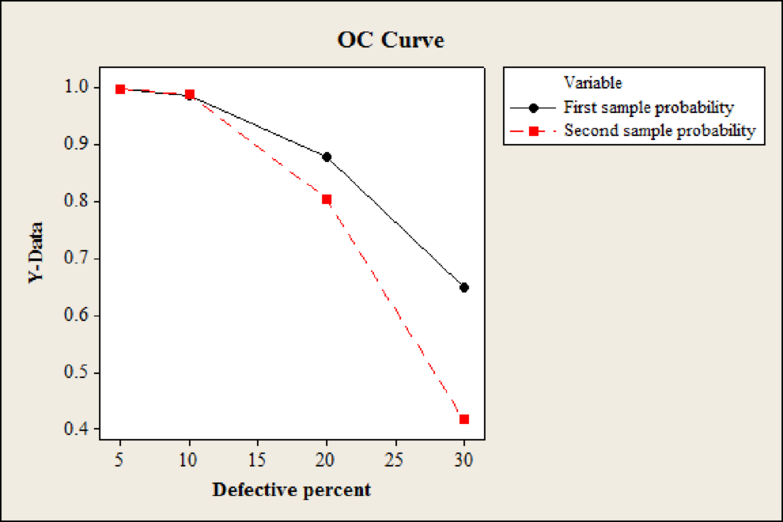
The probability of accepting lots that are 5%, 10%, 20%, and 30% defective is,
| Defective Percent | Probability of acceptance |
| 5 | 0.999 |
| 10 | 0.987 |
| 20 | 0.879 |
| 30 | 0.649 |
Second sampling plan:
For 5% defective:
The probability of accepting lots that is 5% defective is,
Compute the probability value for x less than or equal to 5 using MINITAB.
Step by step procedure to obtain probability using MINITAB software is given as,
- Choose Calc > Probability Distributions > Binomial Distribution.
- Choose Cumulative probability.
- Enter Number of trials as 20 and Event probability as 0.05.
- In Input constant, enter 5.
- Click OK.
Output using MINITAB software is given below:
From the MINITAB output, the probability value is 0.999. That is,
For 10% defective:
The probability of accepting lots that is 10% defective is,
Compute the probability value for x less than or equal to 5 using MINITAB.
Step by step procedure to obtain probability using MINITAB software is given as,
- Choose Calc > Probability Distributions > Binomial Distribution.
- Choose Cumulative probability.
- Enter Number of trials as 20 and Event probability as 0.10.
- In Input constant, enter 5.
- Click OK.
Output using MINITAB software is given below:
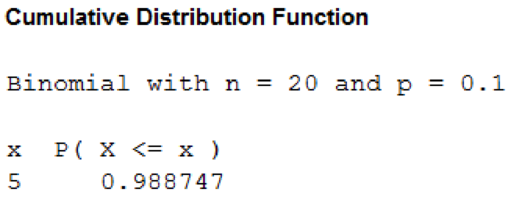
From the MINITAB output, the probability value is 0.988. That is,
For 20% defective:
The probability of accepting lots that is 20% defective is,
Compute the probability value for x less than or equal to 5 using MINITAB.
Step by step procedure to obtain probability using MINITAB software is given as,
- Choose Calc > Probability Distributions > Binomial Distribution.
- Choose Cumulative probability.
- Enter Number of trials as 20 and Event probability as 0.20.
- In Input constant, enter 5.
- Click OK.
Output using MINITAB software is given below:
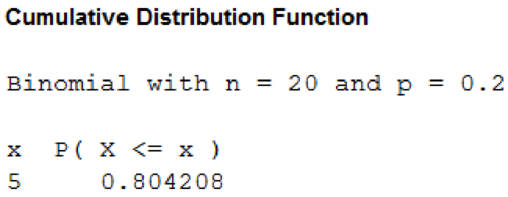
From the MINITAB output, the probability value is 0.804. That is,
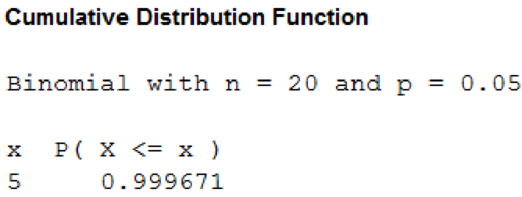
For 30% defective:
The probability of accepting lots that is 30% defective is,
Compute the probability value for x less than or equal to 5 using MINITAB.
Step by step procedure to obtain probability using MINITAB software is given as,
- Choose Calc > Probability Distributions > Binomial Distribution.
- Choose Cumulative probability.
- Enter Number of trials as 20 and Event probability as 0.30.
- In Input constant, enter 5.
- Click OK.
Output using MINITAB software is given below:
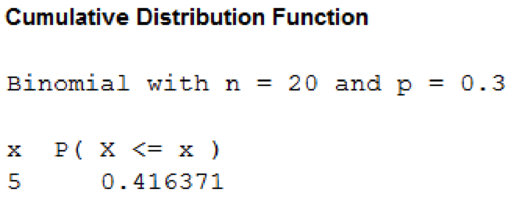
From the MINITAB output, the probability value is 0.416. That is,
The probability of accepting lots that are 5%, 10%, 20%, and 30% defective is,
| Defective Percent | Probability of acceptance |
| 5 | 0.999 |
| 10 | 0.988 |
| 20 | 0.804 |
| 30 | 0.416 |
Step by step procedure to obtain OC curve using MINITAB software is given as,
- Choose Graph > Scatterplot > select With Connect Line.
- In Y variable enter the column First sample probability.
- In X variable enter the column Defective percent.
- In Y variable enter the column Second sample probability.
- In X variable enter the column Defective percent.
- Select Multiple Graphs.
- Mark on Overlaid on the same graph under Show pairs of graph varibales.
- Click OK.
From the output, the black line represents the operating characteristic curve for the first plan and the red line represents the operating characteristic curve for the second plan. The probability of acceptance is more for first plan when compared with second plan because the probability line is above the probability line of second plan.
Since the probability of acceptance is higher for the first plan, the supplier should prefer first plan. But, it the supplier also takes the quality into account then supplier would prefer second plan because the percentage of defects is very low when compared to first plan.
Want to see more full solutions like this?
Chapter 19 Solutions
EBK STATISTICAL TECHNIQUES IN BUSINESS


 Holt Mcdougal Larson Pre-algebra: Student Edition...AlgebraISBN:9780547587776Author:HOLT MCDOUGALPublisher:HOLT MCDOUGAL
 Glencoe Algebra 1, Student Edition, 9780079039897...AlgebraISBN:9780079039897Author:CarterPublisher:McGraw Hill
 College Algebra (MindTap Course List)AlgebraISBN:9781305652231Author:R. David Gustafson, Jeff HughesPublisher:Cengage Learning