
Videos
The data in Table 2.13 are a sample from a larger data set collected on people discharged from a selected Pennsylvania hospital as part of a retrospective chart review of antibiotic usage in hospitals [7]. The data are also given in Data Set HOSPITAL.DAT with documentation in HOSPITAL. DOC at www.cengagebrain.com. Each data set at www.cengagebrain.com is available in six formats: ASCII, MINITAB-readable format, Excel-readable format, SAS-readable format, SPSS-readable format, and Stata-readable format, and as a text file (R-readable format).
Compute the mean and
Find the mean for the duration of hospitalization for the 25 patients.
Find the median for the duration of hospitalization for the 25 patients.
Answer to Problem 1P
The mean for the duration of hospitalization for the 25 patients is 8.6 days.
The median for the duration of hospitalization for the 25 patients is 8 days.
Explanation of Solution
Calculation:
Mean and median:
Step by step procedure to obtain mean and median using MINITAB software is given as,
- Choose Stat > Basic Statistics > Display Descriptive Statistics.
- In Variables enter the column Dur_stay.
- Choose option statistics, and select Mean, Median.
- Click OK.
Output using MINITAB software is given below:
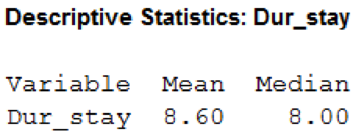
Hence, the mean for the duration of hospitalization for the 25 patients is 8.6 days, and the median is 8 days.
Want to see more full solutions like this?
Chapter 2 Solutions
Fundamentals of Biostatistics


- The scientific productivity of major world cities was the subject of a recent study. The study determined the number of scientific papers published between 1994 and 1997 by researchers from each of the 20 world cities, and is shown below. City Number of papers City Number of papers City 1 1616 City 11 33 City 2 2626 City 12 99 City 3 1212 City 13 2121 City 4 55 City 14 44 City 5 22 City 15 55 City 6 2626 City 16 44 City 7 66 City 17 2020 City 8 2525 City 18 1717 City 9 1616 City 19 2222 City 10 66 City 20 2525 Construct a 95 % confidence interval for the average number of papers published in major world cities. blank <μ<blankarrow_forwardA simple random sample of front-seat occupants involved in car crashes is obtained. Among3000occupants not wearing seat belts,36were killed. Among 7697occupants wearing seat belts,18were killed. Use a0.05significance level to test the claim that seat belts are effective in reducing fatalities. Complete parts (a) through (c) below.arrow_forwardAssume that the population consists of only these eleven data points for y and z. Construct one sample for y and one another sample for z by using 5 data points which gives the maximum variance.arrow_forward
- assume that the data was obtained from two indepen-dent samples. That is, 28 subjects were enrolled into the study, and half were randomly assignedto the corn flakes diet, and half to the oat bran diet. After two weeks the LDL cholesterol level ofeach individual was recorded. LDL (mmol/l)Subject Corn Flakes Oat Bran1 4.61 3.842 6.42 5.573 5.40 5.854 4.54 4.805 3.98 3.686 3.82 2.967 5.01 4.418 4.34 3.729 3.80 3.4910 4.56 3.8411 5.35 5.2612 3.89 3.7313 2.25 1.8414 4.24 4.14 Questions; a) What are the appropriate null and alternative hypotheses for a two-sided test?(b) Conduct the test at the 0.05 level of significance. What is the p-value?(c) Construct a 95% confidence interval.arrow_forwardThe manager of a fleet automobiles is testing two brands of radial tires and assigns one tire of each brand at random to the two rear wheels of eight cars and runs the cars until the tires wear out. The data (in kilometers) follow. Car Brand 1 Brand 2 1 36,925 34,3182 45,300 42,2803 36,240 35,5004 32,100 31,9505 37,210 38,0156 48,360 47,8007 38,200 37,8108 33,500 33,215 Do the data suggest that the two brands of radial tires prove the same mean life? Use ? = 0.01.arrow_forwardTable 11.52 provides a recent survey of the youngest online entrepreneurs whose net worth is estimated at one million dollars or more. Their ages range from 17 to 30. Each cell in the table illustrates the number of entrepreneurs who correspond to the specific age group and their net worth. Are the ages and net worth independent? Perform a test of independence at the 5% significance level. Age Group\Net Worth Value (in millions of US dollars) 1-5 6-24 _>25 Row Total 17-25 8 7 5 20 26-30 6 5 9 20 Column Total 14 12 14 40arrow_forward
- When companies are designing a new product, one of the steps typically taken is to see how potential buyers react to a picture or prototype of the proposed product. The product-development team for a notebook computer company has shown picture A to a large sample of potential buyers and picture B to another, asking each person to indicate what they "would expect to pay" for such a product. The data resulting from the two pictures are provided in file (sheet 6). Using the 0.05 level of significance, determine whether the prototypes might not really differ in terms of the price that potential buyers would expect to pay. Sheet 6 ComputerA ComputerB 3 317 2 965 2 680 3 083 3 286 3 137 2 859 2 950 2 693 3 161 2 945 2 918 2 908 3 158 3 193 3 082 3 240 2 903 3 040 3 103…arrow_forwardFor the three clusters identified in the accompanying Distance Matrix After Second Clustering table, find the average and standard deviations of each numerical variable for the schools in each cluster and compare them with the average and standard deviation for the entire data set. Does the clustering show distinct differences among these clusters? Compute the overall mean and overall standard deviation for each numerical variable. Median SAT Acceptance Rate Expenditures /Student Top 10% HS Graduation % Overall Mean enter your response here enter your response here% $enter your response here enter your response here enter your response here Overall Stdev enter your response here enter your response here% $enter your response here enter your response here enter your response here (Round to two decimal places as needed. Type N if the solution is undefined.) Colleges and Universities School Type…arrow_forwardIn a study of three nationally representative large- scale data sets from Ireland, the United States, and the United Kingdom (n = 17,247), teenagers between the ages of 12 to 15 were asked to keep a diary of their screen time and answer questions about how they felt or acted. Identify the explanatory variables. Comment on wheter the results of the study can be generalized to the population and whyarrow_forward
- A study was conducted to examine if children with autism spectrum disorder (ASD) had higher prenatal exposure to air pollution, specifically particulate matter < 2.5 g in diameter (PM2.5). Researchers obtained birth records of all children born in Los Angeles between 2000 and 2008 and linked these to the Department of Developmental Services records to determine if any of those subjects had been diagnosed with ASD or not. They used the birth addresses given in the birth records to determine the average daily PM2.5 for the third trimester for each child. The standard deviation for PM2.5 among ASD subjects was found to be 34.6 and for non-ASD subjects was 16.8. Assume PM2.5 is normally distributed. 4a. What was the study design? * Randomized Clinical Trial (RCT) * Case Report * Nested Case-Control Study * Case-Control Study * cross-sectional study Cohort Study 4B. What are the null and alternative hypotheses? 4c. What type of statistical test would you use to analyze the…arrow_forwardThe article “Calibration of an FTIR Spectrometer” (P. Pankratz, Statistical Case Studies for Industrial and Process Improvement, SIAM-ASA, 1997: 19–38) describes the use of a spectrometer to make five measurements of the carbon content (in ppm) of a certain silicon wafer whose true carbon content was known to be 1.1447 ppm. The measurements were 1.0730, 1.0825, 1.0711, 1.0870, and 1.0979. a) Is it possible to estimate the uncertainty in these measurements? If so, estimate it. If not, explain why not. b) Is it possible to estimate the bias in these measurements? If so, estimate it. If not, explain why not.arrow_forward
 Linear Algebra: A Modern IntroductionAlgebraISBN:9781285463247Author:David PoolePublisher:Cengage Learning
 Glencoe Algebra 1, Student Edition, 9780079039897...AlgebraISBN:9780079039897Author:CarterPublisher:McGraw Hill