
Videos
In Section 2.6. we will learn additional techniques to graph functions by recognizing characteristics of the functions. In many cases, we can also graph families of functions by relating them to one of several basic graphs.To prepare for the discussion in Section 2.6, use a graphing utility or plot points to graph the basic functions in Exercises 18.
1.
Tograph: plot the graph for the basic function
Explanation of Solution
Given information: The given function is
Calculations:
To obtain the graph of the given function prepare a table containing arbitrary values
Then plot the points and join them using graphic utility.
| X | -3 | -2 | -1 | 0 | 1 | 2 | 3 |
| Y | 1 | 1 | 1 | 1 | 1 | 1 | 1 |
Graph:
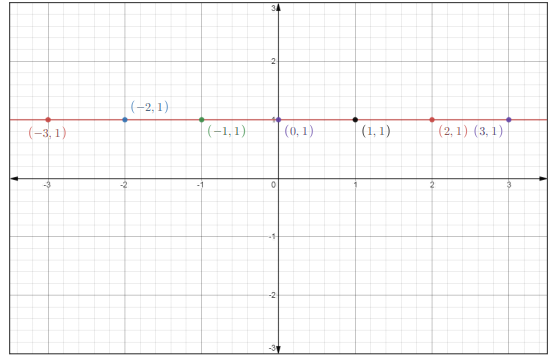
Interpretation:
The line
Want to see more full solutions like this?
Chapter 2 Solutions
COLL.ALGEBRA & TRIG ACCESS


 Holt Mcdougal Larson Pre-algebra: Student Edition...AlgebraISBN:9780547587776Author:HOLT MCDOUGALPublisher:HOLT MCDOUGAL
 Algebra & Trigonometry with Analytic GeometryAlgebraISBN:9781133382119Author:SwokowskiPublisher:Cengage
 Big Ideas Math A Bridge To Success Algebra 1: Stu...AlgebraISBN:9781680331141Author:HOUGHTON MIFFLIN HARCOURTPublisher:Houghton Mifflin Harcourt
 Elementary Geometry For College Students, 7eGeometryISBN:9781337614085Author:Alexander, Daniel C.; Koeberlein, Geralyn M.Publisher:Cengage,