Indifference curve and budget line in the work-leisure model.
Explanation of Solution
An indifference curve in work-leisure model represents the combination of real income and leisure time that provide the same level of satisfaction to the worker.
In work-leisure model, budget line represents all possible combinations of real income and leisure that the worker obtained from the given wage rate.
The indifference curve is downward sloping, which means that it is negatively sloped because the workers are willing to give up leisure time in order to get more income and maintain equal satisfaction. If the time spent on leisure is reduced, income will increase. Thus, the indifference curve will be downward sloping.
Another major feature is that indifference curve is convex to the origin. The convexity implies that the marginal rate of substitution between income and leisure time decreases as a worker moves along the indifference curve, where the marginal rate of substitution indicates that one is given up for another. Thus, the indifference curve is convex to the origin.
The graphical representation of indifference curve and budget line is represented as follows:
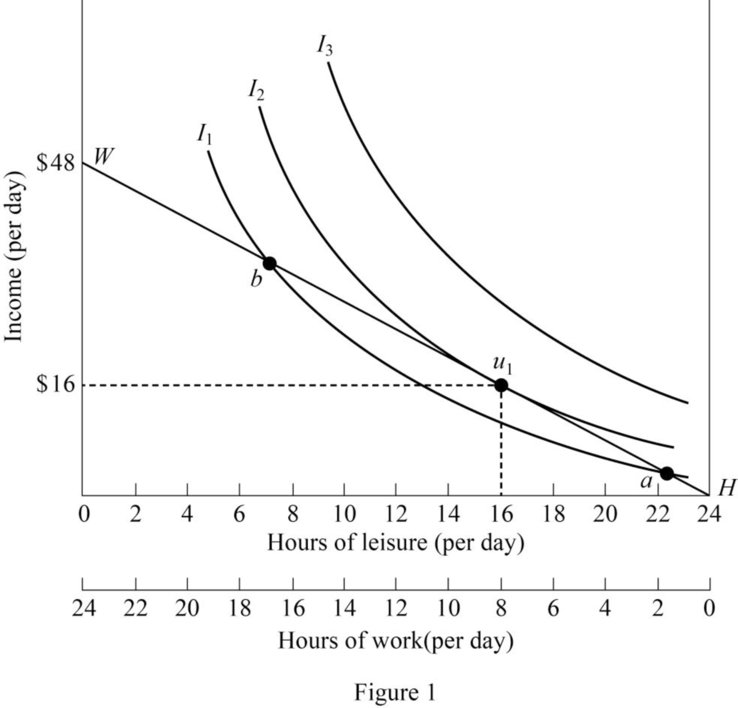
In the figure, the horizontal axis represents hours of leisure and work and the vertical axis represents income. The downward sloping curve is the budget line of the worker. IC1, IC2, and IC3 are the indifference curves. The tangent point of budget constraints and indifference curve indicates the optimal choice. Thus, in the figure, U1 is the optimal point, where the worker will work for 8 hours per day and 16 hours spend for leisure in order to get $16 each day.
Want to see more full solutions like this?
Chapter 2 Solutions
Contemporary Labor Economics

- Define the contingent worker?arrow_forwardWhat happens to the probability that a particular person works when the wage rises? Does such a wage increase generate an income effect?arrow_forwardHumanity is faced with a tough choice, work or leisure. Within the theory of consumer behaviour, apply the labour-leisure choice model to explain what happens when there are two (2) consecutive increases in the wage rate of a an individual and use that to derive the individual's 1.labour supply curve 2.demand for leisure curvearrow_forward
- Follow up question g. Explain why the utility curves cannot be drawn so as to induce the worker to work between L1 and L2 hours. h Yelowitz (1995) studies a Medicaid reform measure that reduced the Medicaid work disincentive. One of the reforms he studied raised the Medicaid eligibility threshold income level by 33%. Draw a new version of the fifigure with a new labor–income curve that reflflects this change. Explain how this change might induce someone currently working L1 hours per year to work more, and be sure to draw indifffference curves to support your answer.arrow_forwardWorkers in countries such as Sweden and Germany work fewer hours per week, on average, than do workers in the United States. Does this mean that Swedes and Germans are lazier than Americans? Explain how laziness could be interpreted in the context of the work-leisure choice model developed in this chapter. What other information might you want to gather to determine whether Swedes or Germans were indeed less work oriented that Americans?arrow_forwardJoanne states: "The best way to increase the wages of workers is to increase workerproductivity." Is Joanne correct? Why or why not?arrow_forward
- Consider worker 1 with non-labor income Y facing a wage offer w and a utility function defined over consumption and leisure U(c,l) = lnC + 4lnl Compare worker 1 with worker 2 whose utility function is described by U(c,l) = cl. Which worker places a higher value on labor market work?arrow_forwardA worker has 110 hours available in a week that can be used for leisure (L) or work (h). The utility function is U = (1 - α)ln(C) + α ln(L), where C is consumption. a) The price per unit of consumption is 1, the hourly wage is w, and the worker has a non-labor income of V. Show that the labor supply is: h* = (110(1-a)- (av)/w). Also, find the demand for consumption and leisure. b) What is the effect on labor supply of i) an increase in the hourly wage and ii) an increase in non-labor income? c) Set α = ½. What are C, L, and h when w = 200 and V = 10000? What is the reservation wage? d) What is the effect on labor supply of i) a 30% income tax and ii) a 10% wealth tax (on V)? e) What is the labor supply if V increases to 11600? f) An increase in V to 11600 gives the worker the same utility as w = 250 and V = 10000 (you do not need to show it). What are the income, substitution, and total effects on labor supply of an increase in wage from 200 to 250 while V remains at 10000?…arrow_forwardWhat relationship might be illustrated by a hedonic wage function: a) the relationship between the wage and a worker's race b) the relationship between the wage and the probability of injury faced by the worker c) the relationship between the wage and a worker's gender d) the relationship between the wage and a worker's skill level e) the relationship between the wage and a worker's agearrow_forward
- Some types of cash grants are provided only to beneficiaries who are out of the labour force. Discuss the effect of these types of grants on work incentives, and illustrate graphically its effect on low salaried workers, with respect to decision to stay or leave the labour forcearrow_forwardASAP pls Discuss the possible substitution effect and the income effect of an increase in income on leisure time..arrow_forwardHow does skill atrophy provide an explanation for differentiation in earnings?arrow_forward
 Managerial Economics: A Problem Solving ApproachEconomicsISBN:9781337106665Author:Luke M. Froeb, Brian T. McCann, Michael R. Ward, Mike ShorPublisher:Cengage Learning