STATISTICS:INFORMED LOOSELEAF+MYSTATLAB
2nd Edition
ISBN: 9780135991893
Author: Sullivan
Publisher: PEARSON
bartleby

Concept explainers

bartleby

Videos

Question
Book Icon
Chapter 2, Problem 1RE

(a)

To determine

The number of participants in the survey.

(a)

Expert Solution
Check Mark

Answer to Problem 1RE

Solution: There are 2216 individuals participating in the survey.

Explanation of Solution

By observing the graph provided in the textbook, it can be seen that the total participants are 2216. The calculation is shown below:

=614+154+1448=2216

(b)

To determine

The relative frequency.

(b)

Expert Solution
Check Mark

Answer to Problem 1RE

Solution: The relative frequency of those respondents who said that the kind of voice makes no difference is 65.3%.

Explanation of Solution

Relative frequency distribution helps in comparing the proportion of observations or frequencies in different class intervals. It is used to decipher which class interval has the greatest or lowest observations out of the entire data provided.

The formula to calculate relative frequency is shown below:

Relative frequency = FrequencyTotal frequency

=14482216=0.653

(c)

To determine

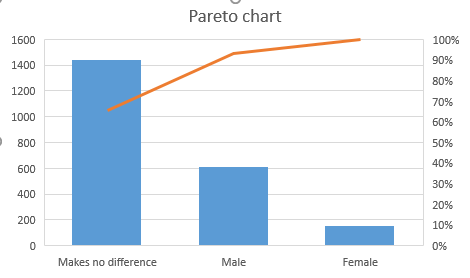
To draw: A pareto chart.

(c)

Expert Solution
Check Mark

Answer to Problem 1RE

Solution: The pareto chart for the provided data is shown below:

STATISTICS:INFORMED LOOSELEAF+MYSTATLAB, Chapter 2, Problem 1RE , additional homework tip  1

Explanation of Solution

To construct a pareto chart on Excel, the steps listed below need to be followed:

Step 1: Enter the data in a new excel sheet.

Step 2: Select the data and click on Charts→Histogram. Choose the pareto chart.

The pareto chart will be obtained.

STATISTICS:INFORMED LOOSELEAF+MYSTATLAB, Chapter 2, Problem 1RE , additional homework tip  2

Conclusion: A pareto chart includes both line and bar graphs. The response or observation with the highest frequency will be listed first. The frequencies will decrease as one goes rightward. The line visible in the chart represents the cumulative frequency.

(d)

To determine

Whether the manufactures use the results.

(d)

Expert Solution
Check Mark

Answer to Problem 1RE

Solution: Yes, they do use the results of the survey.

Explanation of Solution

According to the pareto chart, there is no preference for a type of voice. Majority of the respondents feel that voice does not affect the commercial.

Want to see more full solutions like this?

Subscribe now to access step-by-step solutions to millions of textbook problems written by subject matter experts!

Chapter 2 Solutions

STATISTICS:INFORMED LOOSELEAF+MYSTATLAB

Ch. 2.1 - 11. Made in America A random sample of 2163 adults...Ch. 2.1 - Prob. 12AYUCh. 2.1 - 13. College Survey In a national survey conducted...Ch. 2.1 - 14. College Survey In a national survey conducted...Ch. 2.1 - Prob. 15AYUCh. 2.1 - Prob. 16AYUCh. 2.1 - 17. Texting A survey of U.S. adults and teens...Ch. 2.1 - 18. Educational Attainment The educational...Ch. 2.1 - Prob. 19AYUCh. 2.1 - Prob. 20AYUCh. 2.1 - Prob. 21AYUCh. 2.1 - Prob. 22AYUCh. 2.1 - Prob. 23AYUCh. 2.1 - 24. Blood Type A phlebotomist draws the blood of a...Ch. 2.1 - Prob. 25AYUCh. 2.1 - Prob. 26AYUCh. 2.1 - 27. StatCrunch Survey Choose a qualitative...Ch. 2.1 - Prob. 28AYUCh. 2.1 - 29. Putting It Together: Online Homework Keeping...Ch. 2.1 - 30. When should relative frequencies be used when...Ch. 2.1 - Prob. 31AYUCh. 2.1 - Prob. 32AYUCh. 2.1 - Prob. 33AYUCh. 2.2 - 1. The categories by which data are grouped are...Ch. 2.2 - Prob. 2AYUCh. 2.2 - 3. The ______ is the difference between...Ch. 2.2 - Prob. 4AYUCh. 2.2 - 5. True or False: There is not one particular...Ch. 2.2 - 6. True or False: Stem-and-leaf plots are...Ch. 2.2 - 7. True or False: The shape of the distribution...Ch. 2.2 - Prob. 8AYUCh. 2.2 - Prob. 9AYUCh. 2.2 - 10. Car Sales A car salesman records the number of...Ch. 2.2 - 11. IQ Scores The following frequency histogram...Ch. 2.2 - Prob. 12AYUCh. 2.2 - Prob. 13AYUCh. 2.2 - In Problems 13 and 14, for each variable...Ch. 2.2 - 15. Predicting School Enrollment To predict future...Ch. 2.2 - Prob. 16AYUCh. 2.2 - Prob. 17AYUCh. 2.2 - Prob. 18AYUCh. 2.2 - Prob. 19AYUCh. 2.2 - Prob. 20AYUCh. 2.2 - Prob. 21AYUCh. 2.2 - Prob. 22AYUCh. 2.2 - Prob. 23AYUCh. 2.2 - Prob. 24AYUCh. 2.2 - 25. Televisions in the Household A researcher with...Ch. 2.2 - 26. Waiting The data below represent the number of...Ch. 2.2 - 27. Gini Index The Gini Index is a measure of how...Ch. 2.2 - 28. Average Income The following data represent...Ch. 2.2 - 29. Cigarette Tax Rates The table shows the tax,...Ch. 2.2 - 30. Dividend Yield A dividend is a payment from a...Ch. 2.2 - Prob. 31AYUCh. 2.2 - Prob. 32AYUCh. 2.2 - Prob. 33AYUCh. 2.2 - Prob. 34AYUCh. 2.2 - Prob. 35AYUCh. 2.2 - Prob. 36AYUCh. 2.2 - Prob. 37AYUCh. 2.2 - Prob. 38AYUCh. 2.2 - Prob. 39AYUCh. 2.2 - Prob. 40AYUCh. 2.2 - Prob. 41AYUCh. 2.2 - Prob. 42AYUCh. 2.2 - Prob. 43AYUCh. 2.2 - Prob. 44AYUCh. 2.2 - Prob. 45AYUCh. 2.2 - 46. Waiting Draw a dot plot of the waiting data...Ch. 2.2 - 47. Putting It Together: Time Viewing a Web Page...Ch. 2.2 - Prob. 48AYUCh. 2.2 - Prob. 49AYUCh. 2.2 - Prob. 50AYUCh. 2.2 - Prob. 51AYUCh. 2.2 - 52. Describe the situations in which it is...Ch. 2.2 - Prob. 53AYUCh. 2.2 - Prob. 54AYUCh. 2.3 - 1. What is an ogive? Ch. 2.3 - Prob. 2AYUCh. 2.3 - Prob. 3AYUCh. 2.3 - Prob. 4AYUCh. 2.3 - Prob. 5AYUCh. 2.3 - Prob. 6AYUCh. 2.3 - 7. Graduation Rates The following relative...Ch. 2.3 - Prob. 8AYUCh. 2.3 - 9. Misery Index The following time-series plot...Ch. 2.3 - Prob. 10AYUCh. 2.3 - Prob. 11AYUCh. 2.3 - In Problems 13–16, use the frequency distributions...Ch. 2.3 - Prob. 13AYUCh. 2.3 - Prob. 14AYUCh. 2.3 - Prob. 15AYUCh. 2.3 - Prob. 16AYUCh. 2.3 - Prob. 17AYUCh. 2.3 - Prob. 18AYUCh. 2.3 - 19. Putting It Together: Rates of Return of Stocks...Ch. 2.3 - Prob. 20AYUCh. 2.3 - Prob. 21AYUCh. 2.3 - Prob. 22AYUCh. 2.3 - Prob. 23AYUCh. 2.4 - 1. Inauguration Cost The following is a USA...Ch. 2.4 - 2. Burning Calories The following is a USA...Ch. 2.4 - Prob. 3AYUCh. 2.4 - Prob. 4AYUCh. 2.4 - Prob. 5AYUCh. 2.4 - Prob. 6AYUCh. 2.4 - Prob. 7AYUCh. 2.4 - 8. You Explain It! Oil Reserves The U.S. Strategic...Ch. 2.4 - Prob. 9AYUCh. 2.4 - Prob. 10AYUCh. 2.4 - Prob. 11AYUCh. 2.4 - Prob. 12AYUCh. 2.4 - Prob. 13AYUCh. 2.4 - Prob. 14AYUCh. 2.4 - Prob. 15AYUCh. 2.4 - Prob. 16AYUCh. 2 - Prob. 1RECh. 2 - Prob. 2RECh. 2 - Prob. 3RECh. 2 - 4. Political Affiliation One hundred randomly...Ch. 2 - 5. Family Size A random sample of 60 couples...Ch. 2 - Prob. 6RECh. 2 - Prob. 7RECh. 2 - Prob. 8RECh. 2 - Prob. 9RECh. 2 - Prob. 10RECh. 2 - Prob. 11RECh. 2 - Prob. 12RECh. 2 - Prob. 1CTCh. 2 - Prob. 2CTCh. 2 - Prob. 3CTCh. 2 - 4. The following data represent the number of cars...Ch. 2 - Prob. 5CTCh. 2 - Prob. 6CTCh. 2 - 7. The following data represent the time (in...Ch. 2 - Prob. 8CTCh. 2 - Prob. 9CTCh. 2 - Prob. 1CSCh. 2 - Prob. 2CSCh. 2 - Prob. 3CSCh. 2 - Prob. 4CSCh. 2 - Prob. 5CSCh. 2 - Prob. 6CS
Knowledge Booster
Background pattern image
Statistics
Learn more about
Need a deep-dive on the concept behind this application? Look no further. Learn more about this topic, statistics and related others by exploring similar questions and additional content below.
Recommended textbooks for you
Text book image
MATLAB: An Introduction with Applications
Statistics
ISBN:9781119256830
Author:Amos Gilat
Publisher:John Wiley & Sons Inc
Text book image
Probability and Statistics for Engineering and th...
Statistics
ISBN:9781305251809
Author:Jay L. Devore
Publisher:Cengage Learning
Text book image
Statistics for The Behavioral Sciences (MindTap C...
Statistics
ISBN:9781305504912
Author:Frederick J Gravetter, Larry B. Wallnau
Publisher:Cengage Learning
Text book image
Elementary Statistics: Picturing the World (7th E...
Statistics
ISBN:9780134683416
Author:Ron Larson, Betsy Farber
Publisher:PEARSON
Text book image
The Basic Practice of Statistics
Statistics
ISBN:9781319042578
Author:David S. Moore, William I. Notz, Michael A. Fligner
Publisher:W. H. Freeman
Text book image
Introduction to the Practice of Statistics
Statistics
ISBN:9781319013387
Author:David S. Moore, George P. McCabe, Bruce A. Craig
Publisher:W. H. Freeman
Correlation Vs Regression: Difference Between them with definition & Comparison Chart; Author: Key Differences;https://www.youtube.com/watch?v=Ou2QGSJVd0U;License: Standard YouTube License, CC-BY
Correlation and Regression: Concepts with Illustrative examples; Author: LEARN & APPLY : Lean and Six Sigma;https://www.youtube.com/watch?v=xTpHD5WLuoA;License: Standard YouTube License, CC-BY