Introduction To Probability And Statistics
15th Edition
ISBN: 9781337554428
Author: Mendenhall, William.
Publisher: Cengage Learning,
bartleby

Videos

Textbook Question
Book Icon
Chapter 2, Problem 1RWYL

Raisins The number of raisins in each of 14miniboxes (1/2 -ounce size) was counted for ageneric brand and for Sunmaid brand raisins. Thetwo data sets are shown here:
Chapter 2, Problem 1RWYL, Raisins The number of raisins in each of 14miniboxes (1/2 -ounce size) was counted for ageneric

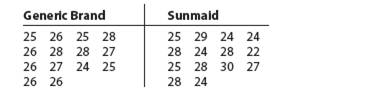
a. What are the mean and the standard deviation for thegeneric brand?
b. What are the mean and the standard deviation for theSunmaid brand?
c. Compare the centers and variabilities of the twobrands using the results of parts a and b.

Expert Solution
Check Mark
To determine

(a)

To find:

The mean and standard deviation for the generic brand.

Answer to Problem 1RWYL

The mean and standard deviation for the generic brand are 26.21 and 1.2514 respectively.

Explanation of Solution

Given information:

The given data is,

Generic Brand Sunmaid
25 26252825292424
2628282728242822
2627242525283027
26 26 2824

Calculation:

The data with calculation is shown in table below.

x(xx¯)2
251.464 1
260.044 1
260.044 1
260.044 1
260.044 1
283.204 1
270.624 1
260.044 1
251.464 1
283.204 1
244.884 1
283.204 1
270.624 1
251.464 1
Total36720.3574

  Table-1

The sample size is n=14.

The mean is,

  x¯=xn=36714=26.21

The standard deviation is,

  s= ( x x ¯ ) 2 n1= 20.3574 141=1.2514

Therefore, the mean and standard deviation for the generic brand are 26.21 and 1.2514 respectively.

Expert Solution
Check Mark
To determine

(b)

To find:

The mean and standard deviation for Sunmaid.

Answer to Problem 1RWYL

The mean and standard deviation for the generic brand are 26.14 and 2.4133 respectively.

Explanation of Solution

Given information:

The given data is,

Generic Brand Sunmaid
25 26252825292424
2628282728242822
2627242525283027
26 26 2824

Calculation:

The data with calculation is shown in table below.

x(xx¯)2
251.2996
283.4596
251.2996
283.4596
298.1796
244.5796
283.4596
244.5796
244.5796
283.4596
3014.8996
244.5796
2217.1396
270.7396
Total36675.7144

  Table-2

The sample size is n=14.

The mean is,

  x¯=xn=36614=26.14

The standard deviation is,

  s= ( x x ¯ ) 2 n1= 75.7144 141=2.4133

Therefore, the mean and standard deviation for the generic brand are 26.14 and 2.4133 respectively.

Expert Solution
Check Mark
To determine

(c)

To compare:

The centers and variability of the brands.

Explanation of Solution

Given information:

The given data is,

Generic Brand Sunmaid
25 26252825292424
2628282728242822
2627242525283027
26 26 2824

The generic brand has smaller standard of deviation as compared to Sunmaid and the mean of generic brand is greater as compared to Sunmaid.

Want to see more full solutions like this?

Subscribe now to access step-by-step solutions to millions of textbook problems written by subject matter experts!

Chapter 2 Solutions

Introduction To Probability And Statistics

Ch. 2.1 - Prob. 11ECh. 2.1 - Prob. 12ECh. 2.1 - Prob. 13ECh. 2.1 - Prob. 14ECh. 2.1 - Prob. 15ECh. 2.1 - Prob. 16ECh. 2.1 - Prob. 17ECh. 2.1 - Fortune 500 Revenues Ten of the...Ch. 2.1 - Prob. 19ECh. 2.1 - Prob. 20ECh. 2.1 - Prob. 21ECh. 2.1 - Prob. 22ECh. 2.2 - Calculating the Standard Deviation I For the data...Ch. 2.2 - Calculating the Standard Deviation I For the data...Ch. 2.2 - Calculating the Standard Deviation I For the data...Ch. 2.2 - Prob. 4ECh. 2.2 - Prob. 5ECh. 2.2 - Prob. 6ECh. 2.2 - Prob. 7ECh. 2.2 - Prob. 8ECh. 2.2 - For the data sets in Exercises 79, find the range,...Ch. 2.2 - Prob. 10ECh. 2.2 - Prob. 11ECh. 2.2 - Sleep and the College Student A group of 10...Ch. 2.2 - Gas Mileage The miles per gallon (mpg) foreach of...Ch. 2.2 - Polluted Seawater Petroleum pollution in seas...Ch. 2.2 - Prob. 15ECh. 2.3 - Approximating the Standard Deviation For the data...Ch. 2.3 - Approximating the Standard Deviation For the data...Ch. 2.3 - Prob. 3ECh. 2.3 - Prob. 4ECh. 2.3 - Prob. 5ECh. 2.3 - Data Set I A distribution of measurements is...Ch. 2.3 - Prob. 7ECh. 2.3 - Data Set I A distribution of measurements is...Ch. 2.3 - Prob. 9ECh. 2.3 - Prob. 10ECh. 2.3 - Prob. 11ECh. 2.3 - Prob. 12ECh. 2.3 - Data Set II A distribution of measurements has a...Ch. 2.3 - Prob. 14ECh. 2.3 - Prob. 15ECh. 2.3 - Prob. 16ECh. 2.3 - Prob. 17ECh. 2.3 - Prob. 18ECh. 2.3 - Prob. 19ECh. 2.3 - Breathing Rates Breathing rates for humans canbe...Ch. 2.3 - Prob. 21ECh. 2.3 - Prob. 22ECh. 2.3 - Prob. 23ECh. 2.3 - Prob. 24ECh. 2.3 - Prob. 25ECh. 2.3 - Prob. 26ECh. 2.3 - Prob. 27ECh. 2.3 - Prob. 28ECh. 2.3 - Prob. 29ECh. 2.3 - Prob. 30ECh. 2.3 - Prob. 31ECh. 2.3 - TV Commercials The mean duration of...Ch. 2.4 - z-ScoresFor the data sets in Exercises 13, find...Ch. 2.4 - z-ScoresFor the data sets in Exercises 13, find...Ch. 2.4 - z-ScoresFor the data sets in Exercises 13, find...Ch. 2.4 - Median and Quartiles For the data in Exercises 46,...Ch. 2.4 - Median and Quartiles For the data in Exercises 46,...Ch. 2.4 - Median and Quartiles For the data in Exercises 46,...Ch. 2.4 - -Number Summary and the Box Plot For each of the...Ch. 2.4 - Five-Number Summary and the Box Plot For each of...Ch. 2.4 - Five-Number Summary and the Box Plot For each of...Ch. 2.4 - Prob. 10ECh. 2.4 - z-Scores vs. Box Plots For the data sets in...Ch. 2.4 - Percentiles What are the percentiles in Exercises...Ch. 2.4 - Percentiles What are the percentiles in Exercises...Ch. 2.4 - Percentiles What are the percentiles in Exercises...Ch. 2.4 - Percentiles What are the percentiles in Exercises...Ch. 2.4 - For the data in Exercises 1617, find the sample...Ch. 2.4 - For the data in Exercises 1617, find the sample...Ch. 2.4 - €For the data in Exercises 1819, find the...Ch. 2.4 - For the data in Exercises 1819, find the...Ch. 2.4 - Prob. 20ECh. 2.4 - Prob. 21ECh. 2.4 - Presidential Vetoes The number of vetoesused by...Ch. 2.4 - Prob. 23ECh. 2.4 - Prob. 24ECh. 2.4 - Ages of Pennies Here are the ages of50 pennies,...Ch. 2.4 - Prob. 26ECh. 2 - Raisins The number of raisins in each of...Ch. 2 - Raisins, continued Refer to Exercise 1. a. Find...Ch. 2 - Prob. 3RWYLCh. 2 - Prob. 4RWYLCh. 2 - Prob. 5RWYLCh. 2 - Prob. 6RWYLCh. 2 - Prob. 7RWYLCh. 2 - Prob. 8RWYLCh. 2 - Prob. 9RWYLCh. 2 - Prob. 10RWYLCh. 2 - Prob. 11RWYLCh. 2 - Prob. 12RWYLCh. 2 - Prob. 13RWYLCh. 2 - Prob. 14RWYLCh. 2 - Prob. 15RWYLCh. 2 - Prob. 16RWYLCh. 2 - Prob. 17RWYLCh. 2 - Prob. 18RWYLCh. 2 - Prob. 19RWYLCh. 2 - Prob. 20RWYLCh. 2 - Prob. 21RWYLCh. 2 - Prob. 22RWYLCh. 2 - Prob. 23RWYLCh. 2 - Prob. 24RWYLCh. 2 - Prob. 25RWYL
Knowledge Booster
Background pattern image
Statistics
Learn more about
Need a deep-dive on the concept behind this application? Look no further. Learn more about this topic, statistics and related others by exploring similar questions and additional content below.
Recommended textbooks for you
Text book image
Glencoe Algebra 1, Student Edition, 9780079039897...
Algebra
ISBN:9780079039897
Author:Carter
Publisher:McGraw Hill
Hypothesis Testing using Confidence Interval Approach; Author: BUM2413 Applied Statistics UMP;https://www.youtube.com/watch?v=Hq1l3e9pLyY;License: Standard YouTube License, CC-BY
Hypothesis Testing - Difference of Two Means - Student's -Distribution & Normal Distribution; Author: The Organic Chemistry Tutor;https://www.youtube.com/watch?v=UcZwyzwWU7o;License: Standard Youtube License