
Concept explainers
Videos
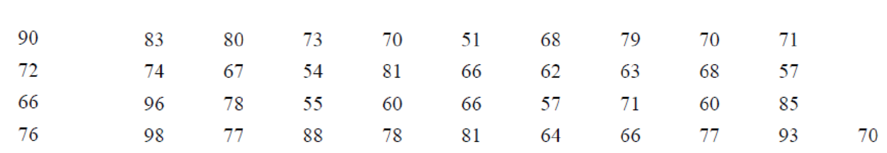
Ages of the Vice Presidents at the Time of Their Death The ages of the Vice Presidents of the United States at the time of their death are listed below. Use the data to construct a frequency distribution.
Use 6 classes. The data for this exercise will be used for Exercises 8, 10, and 12.
Source: World Almanac and Book of Facts.
To construct: The frequency distribution of the given data.
Answer to Problem 2.1.6RE
The frequency distribution is shown below:
| Class | Frequency
|
Cumulative frequency | Cumulative percentage |
| 50.5-59.5 | 5 | 5 |
|
| 59.5-68.5 | 12 | 17 |
|
| 68.5-77.5 | 11 | 28 |
|
| 77.5-86.5 | 8 | 36 |
|
| 86.5-95.5 | 3 | 39 |
|
| 95.5-104.5 | 2 | 41 |
|
| Total | 41 |
Explanation of Solution
Given info:
The given data shown below:
| 90 | 83 | 80 | 73 | 70 | 51 | 68 | 79 | 70 | 71 |
| 72 | 74 | 67 | 54 | 81 | 66 | 62 | 63 | 68 | 57 |
| 66 | 96 | 78 | 55 | 60 | 66 | 57 | 71 | 60 | 85 |
| 76 | 98 | 77 | 88 | 78 | 81 | 64 | 66 | 77 | 93 |
| 70 |
The number of classes is 6.
Calculation:
Step-by-step procedure to construct frequency distribution table is as follows:
- The number of classes is 6.
- Here the minimum number is 51 and maximum number is 98. Thus, the range is
Class width is obtained by dividing the range by the number of classes.
Thus,
Since, the number of 6 classes the class width is considered as 9.
- Here the lower limit is 51 and hence the lower boundary is 50.5. Also, the class width is 9. Thus the upper limit is 59 and the upper boundary is 59.5. Similarly, the other upper and the lower boundaries are obtained.
- Make a tally mark for each entry in the corresponding class and continue for all ages in the data.
- The number of tally marks in each class represents the frequency, f of that class.
Thus, the frequency distribution table the distribution of declaration of independence is as follows,
| Class | Tally | Frequency
|
| 50.5-59.5 |
|
5 |
| 59.5-68.5 |
|
12 |
| 68.5-77.5 |
|
11 |
| 77.5-86.5 |
|
8 |
| 86.5-95.5 |
|
3 |
| 95.5-104.5 |
|
2 |
Relative frequency:
The portion of the data that falls in the corresponding class is relative frequency of that class.
Thus, the relative frequency for each class is tabulated below,
| Class | Frequency
|
Relative frequency |
| 50.5-59.5 | 5 |
|
| 59.5-68.5 | 12 |
|
| 68.5-77.5 | 11 |
|
| 77.5-86.5 | 8 |
|
| 86.5-95.5 | 3 |
|
| 95.5-104.5 | 2 |
|
| Total | 41 |
Calculate the cumulative percentage.
Thus the frequency distribution is,
| Class | Frequency
|
Mid value | Cumulative frequency | Cumulative percentage |
| 50.5-59.5 | 5 | 55 | 5 |
|
| 59.5-68.5 | 12 | 64 | 17 |
|
| 68.5-77.5 | 11 | 73 | 28 |
|
| 77.5-86.5 | 8 | 82 | 36 |
|
| 86.5-95.5 | 3 | 91 | 39 |
|
| 95.5-104.5 | 2 | 100 | 41 |
|
| Total | 41 |
Want to see more full solutions like this?
Chapter 2 Solutions
ELEMENTARY STATISTICS W/CONNECT >IP<


 Glencoe Algebra 1, Student Edition, 9780079039897...AlgebraISBN:9780079039897Author:CarterPublisher:McGraw Hill
 Holt Mcdougal Larson Pre-algebra: Student Edition...AlgebraISBN:9780547587776Author:HOLT MCDOUGALPublisher:HOLT MCDOUGAL