
Videos
Construct a histogram, frequency
Use 6 classes. The data for this exercise will be used for Exercises 8, 10, and 12.
Source: World Almanac and Book of Facts.
To construct: Histogram, frequency polygon, and Ogive for the given data.
Answer to Problem 2.2.10RE
Output using EXCEL software is given below:
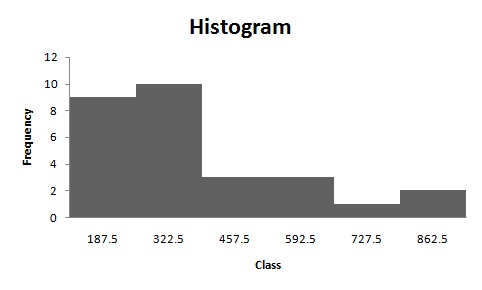
Histogram:
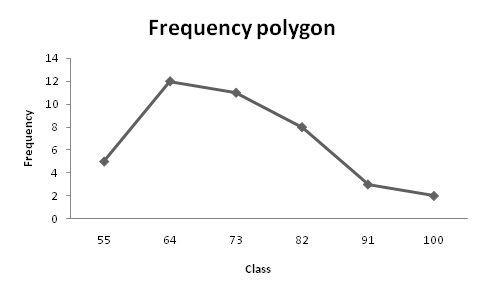
Frequency polygon:
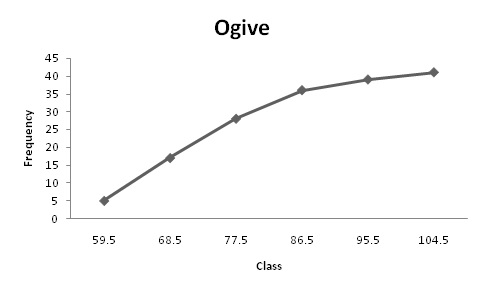
Ogive:
Explanation of Solution
Refer to Exercise 6.
Given info: the given data shown below:
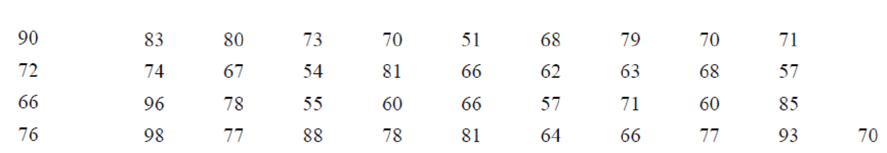
| 90 | 83 | 80 | 73 | 70 | 51 | 68 | 79 | 70 | 71 |
| 72 | 74 | 67 | 54 | 81 | 66 | 62 | 63 | 68 | 57 |
| 66 | 96 | 78 | 55 | 60 | 66 | 57 | 71 | 60 | 85 |
| 76 | 98 | 77 | 88 | 78 | 81 | 64 | 66 | 77 | 93 |
| 70 |
Calculation:
Step-by-step procedure to construct frequency distribution table is as follows:
The number of classes is 6.
Here, the minimum number is 51 and maximum number is 98. Thus, the range is,
Class width is obtained by dividing the range by the number of classes.
Thus,
Since, we have to make 6 classes for given data we take class width 9 for convenient.
Lower class limits:
- The class limits are obtained by taking the minimum value or less than minimum value as lower limit for the first class. For second class, the lower limit is obtained by adding the class width to the previous class lower limit. That is,
Upper class limits:
- For the first class, the upper limit is one less than the lower limit of the second class that is,
Thus, the lower class and upper class limits are as follows:
| Lower limit | Upper limit |
| 50.5 |
|
|
|
|
|
|
|
|
|
|
|
|
|
|
|
|
- Make a tally mark for each entry in the corresponding class and continue for all number of children in the data.
- The number of tally marks in each class represents the frequency, f of that class.
Thus, the frequency distribution table the distribution of declaration of independence is as follows,
| Class | Tally | Frequency
|
| 50.5-59.5 |
|
5 |
| 59.5-68.5 |
|
12 |
| 68.5-77.5 |
|
11 |
| 77.5-86.5 |
|
8 |
| 86.5-95.5 |
|
3 |
| 95.5-104.5 |
|
2 |
Relative frequency:
The portion of the data that falls in the corresponding class is relative frequency of that class.
Thus, the relative frequency for each class is tabulated below,
| Class | Frequency
|
Relative frequency |
| 50.5-59.5 | 5 |
|
| 59.5-68.5 | 12 |
|
| 68.5-77.5 | 11 |
|
| 77.5-86.5 | 8 |
|
| 86.5-95.5 | 3 |
|
| 95.5-104.5 | 2 |
|
| Total | 41 |
Thus the data for constructing histogram is
| Class | Frequency
|
Mid value | Cumulative frequency |
| 50.5-59.5 | 5 | 55 | 5 |
| 59.5-68.5 | 12 | 64 | 17 |
| 68.5-77.5 | 11 | 73 | 28 |
| 77.5-86.5 | 8 | 82 | 36 |
| 86.5-95.5 | 3 | 91 | 39 |
| 95.5-104.5 | 2 | 100 | 41 |
| Total | 41 |
Histogram:
Software procedure:
Step-by-step procedure to construct the Histogram by using EXCEL is given below:
- Enter the data in column A of new worksheet, one number per cell.
- Enter the boundaries in column B.
- From the toolbar, select the Data tab, the select data analysis.
- In data analysis, select HISTOGRAM and click ok.
- In HISTOGRAM dialog box, type A1:A6 in the input range.
- Click ok and histogram shown below,
The histogram show the distribution is positively skewed.
Frequency polygon:
Step-by-step procedure to construct the frequency polygon by using EXCEL is given below:
- Enter midpoint and frequency in column A and column B respectively.
- Select the insert tab from the toolbar and line chart option.
- Select 2-D line chart.
Frequency polygon shown below,
Ogive:
Software procedure:
- Enter upper class boundaries and cumulative frequency in column A and column B respectively.
- Select the insert tab from the toolbar and line chart option.
- Select 2-D line chart
Want to see more full solutions like this?
Chapter 2 Solutions
Elementary Statistics: A Step By Step Approach


 Big Ideas Math A Bridge To Success Algebra 1: Stu...AlgebraISBN:9781680331141Author:HOUGHTON MIFFLIN HARCOURTPublisher:Houghton Mifflin Harcourt
 Glencoe Algebra 1, Student Edition, 9780079039897...AlgebraISBN:9780079039897Author:CarterPublisher:McGraw Hill
 Holt Mcdougal Larson Pre-algebra: Student Edition...AlgebraISBN:9780547587776Author:HOLT MCDOUGALPublisher:HOLT MCDOUGAL