
Concept explainers
Videos
The breakdown of U.S. cities having a population of at least 10,000 persons has been reported as follows. Source: Bureau of the Census, Statistical Abstract of the United States 2009, p.34.
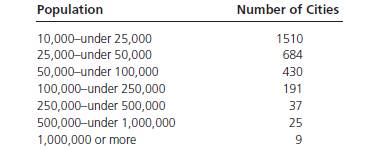
a. How many cities have a population of a least 25,000 but less than 500,000?
b. How many cities have a population less than 2.50,000?
c. How many cities have a population of at least 100,000 but less than 1,000,000? What percentage of cities are in this group?
d. What is the class mark for the 100,000—under 250,000 class?
e. Convert the table to a relative frequency distribution.
(a)
To find:
The number of cities that have a population of at least 25,000 but less than 500,000.
Answer to Problem 2.55CE
1342.
Explanation of Solution
Given:
Frequency distribution is:
| Population | Number of Cities |
| 10,000- under 25,000 | 1510 |
| 25,000 -under 50,000 | 684 |
| 50,000 -under 100,000 | 430 |
| 100,000 - under 250,000 | 191 |
| 250,000 - under 500,000 | 37 |
| 500,000- under 1,000,000 | 25 |
| 1,000,000 or more | 9 |
The number of cities that have a population of at least 25,000 but less than 500,000 can be calculated as:
Hence, the required number is 1342.
(b)
To find:
The number of cities that have population of less than 250,000.
Answer to Problem 2.55CE
2815.
Explanation of Solution
The number of cities that have a population less than 250,000 can be calculated as:
Hence, the required number is 2815.
(c)
To find:
The number of cities that have a population of at least 100,000 but less than 1,000,000. Also, find the percentages of cities in this group.
Answer to Problem 2.55CE
253 cities and 8.77%.
Explanation of Solution
The number of cities that have a population of at least 100,000 but less than 1,000,000 can be calculated as:
The percentage of cities in this group be calculated as:
(d)
To find:
The class mark for the class 100,000-under 250,000.
Answer to Problem 2.55CE
175000.
Explanation of Solution
The class-mark or mid-point of an interval is calculated as:
The class mark for the class 100,000-under 250,000can be calculated as:
(d)
To find:
A relative frequency distribution for the provided data set.
Explanation of Solution
| Population | Relative frequency |
| 10,000- under 25,000 | 0.523 |
| 25,000 -under 50,000 | 0.237 |
| 50,000 -under 100,000 | 0.149 |
| 100,000 - under 250,000 | 0.066 |
| 250,000 - under 500,000 | 0.013 |
| 500,000- under 1,000,000 | 0.009 |
| 1,000,000 or more | 0.003 |
Want to see more full solutions like this?
Chapter 2 Solutions
Introduction to Business Statistics
Additional Math Textbook Solutions
PRACTICE OF STATISTICS F/AP EXAM
Statistics: The Art and Science of Learning from Data (4th Edition)
Statistics Through Applications
Essentials of Statistics, Books a la Carte Edition (5th Edition)
Elementary Statistics (Text Only)
EBK STATISTICAL TECHNIQUES IN BUSINESS


 MATLAB: An Introduction with ApplicationsStatisticsISBN:9781119256830Author:Amos GilatPublisher:John Wiley & Sons Inc
 Probability and Statistics for Engineering and th...StatisticsISBN:9781305251809Author:Jay L. DevorePublisher:Cengage Learning
 Statistics for The Behavioral Sciences (MindTap C...StatisticsISBN:9781305504912Author:Frederick J Gravetter, Larry B. WallnauPublisher:Cengage Learning
 Elementary Statistics: Picturing the World (7th E...StatisticsISBN:9780134683416Author:Ron Larson, Betsy FarberPublisher:PEARSON
 The Basic Practice of StatisticsStatisticsISBN:9781319042578Author:David S. Moore, William I. Notz, Michael A. FlignerPublisher:W. H. Freeman
 Introduction to the Practice of StatisticsStatisticsISBN:9781319013387Author:David S. Moore, George P. McCabe, Bruce A. CraigPublisher:W. H. Freeman