
Videos
Cincinnati, Ohio, also known as the Queen City, has a population of approximately 298,000 and is the third largest city in the state of Ohio. The Cincinnati metropolitan area has a population of about 2.2 million. The city is governed by a mayor and a nine-member city council. The city manager, who is responsible for the day-to-day operation of the city, reports to the mayor and city council. The city manager recently created the Office of Performance and Data Analytics with the goal of improving the efficiency of city operations. One of the first tasks of this new office is to review the previous year’s expenditures. The file QueenCity contains data on the previous year’s expenditures, including the following:
Department: The number of the department incurring the expenditure
Department Description: The name of the department incurring the description
Category: The category of the expenditure
Fund: The fund to which the expenditure was charged
Expenditure: The dollar amount of the expense
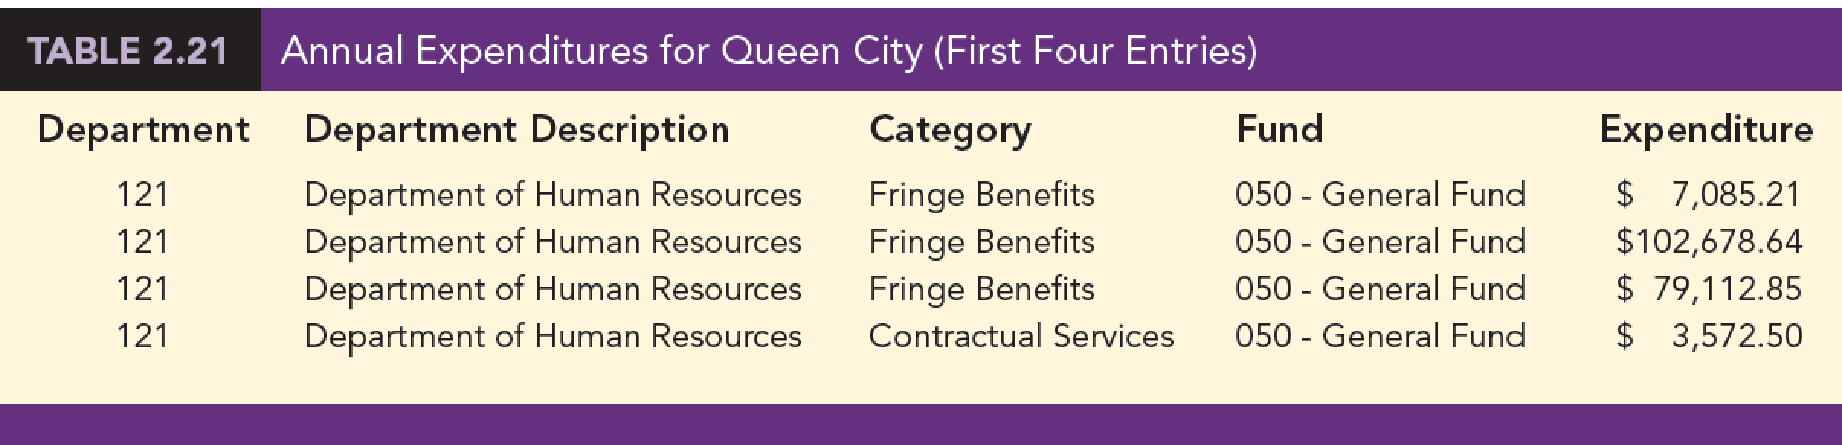
Table 2.21 shows the first four entries of the 5427 expenditures for the year. The city manager would like to use this data to better understand how the city’s budget is being spent.
Manageri al Report
Use tabular and graphical methods of
- 1. Tables and/or graphical displays that show the amount of expenditures by category and percentage of total expenditures by category.
- 2. A table that shows the amount of expenditures by department and the percentage of total expenditures by department. Combine any department with less than 1% into a category named “Other.”
- 3. A table that shows the amount of expenditures by fund and the percentage of total expenditures by fund. Combine any fund with less than 1% into a category named “Other.”
1.
Make tabular and graphical displays that show the amount of expenditure by category and percentage of total expenditures by category.
Answer to Problem 3CP
The following table represents the total amount of expenditure by category and percentage of total expenditures by category:
| Category | Total expenditure | Percentage of total expenditure |
| Capital | $198,365,854 | 29.98% |
| Payroll | $145,017,555 | 21.92% |
| Debt service | $86,913,978 | 13.14% |
| Contractual services | $85,043,249 | 12.85% |
| Fringe benefits | $66,053,340 | 9.98% |
| Fixed costs | $53,732,177 | 8.12% |
| Materials and supplies | $19,934,710 | 3.01% |
| Inventory | $6,393,394 | 0.97% |
| Payables | $180,435 | 0.03% |
| Grand Total | $661,634,693 | 100.0% |
The bar chart for “Category” is given below:

Explanation of Solution
Calculation:
The table represents the sample of 5,427 entries and the annual expenditures for queen city (City C and City O) for the year. The five types of variables present in the data are department serial number, department description, category name, fund, and expenditure.
From the data set, the variable “Category” consists of nine entities, namely capital, payroll, debt service, contractual services, fringe benefits, fixed costs, materials and supplies, inventory, and payable.
Therefore, the following table shows the amount of all nine entities’ total expenditure by category:
| Category | Total expenditure |
| Capital | $198,365,854 |
| Payroll | $145,017,555 |
| Debt service | $86,913,978 |
| Contractual services | $85,043,249 |
| Fringe benefits | $66,053,340 |
| Fixed costs | $53,732,177 |
| Materials and supplies | $19,934,710 |
| Inventory | $6,393,394 |
| Payables | $180,435 |
| Grand Total | $661,634,693 |
The percentage for capital is calculated as the ratio of total expenditure for capital to the grand totals of all categories.
The following table shows the percentage of amount of all nine entities’ total expenditure by category:
| Category | Total expenditure | Percentage of total expenditure |
| Capital | $198,365,854 | 29.98% |
| Payroll | $145,017,555 | 21.92% |
| Debt service | $86,913,978 | 13.14% |
| Contractual services | $85,043,249 | 12.85% |
| Fringe benefits | $66,053,340 | 9.98% |
| Fixed costs | $53,732,177 | 8.12% |
| Materials and supplies | $19,934,710 | 3.01% |
| Inventory | $6,393,394 | 0.97% |
| Payables | $180,435 | 0.03% |
| Grand Total | $661,634,693 | 100.0% |
Software procedure:
Step-by-step software procedure to obtain the bar chart for category using EXCEL software:
- In Excel sheet, enter Category in one column and Percentage of total Expenditure in another column.
- Select the data, and then choose Insert > Insert Column Bar Charts.
- Select Clustered Column under More Column Charts.
Output using the EXCEL software is given below:
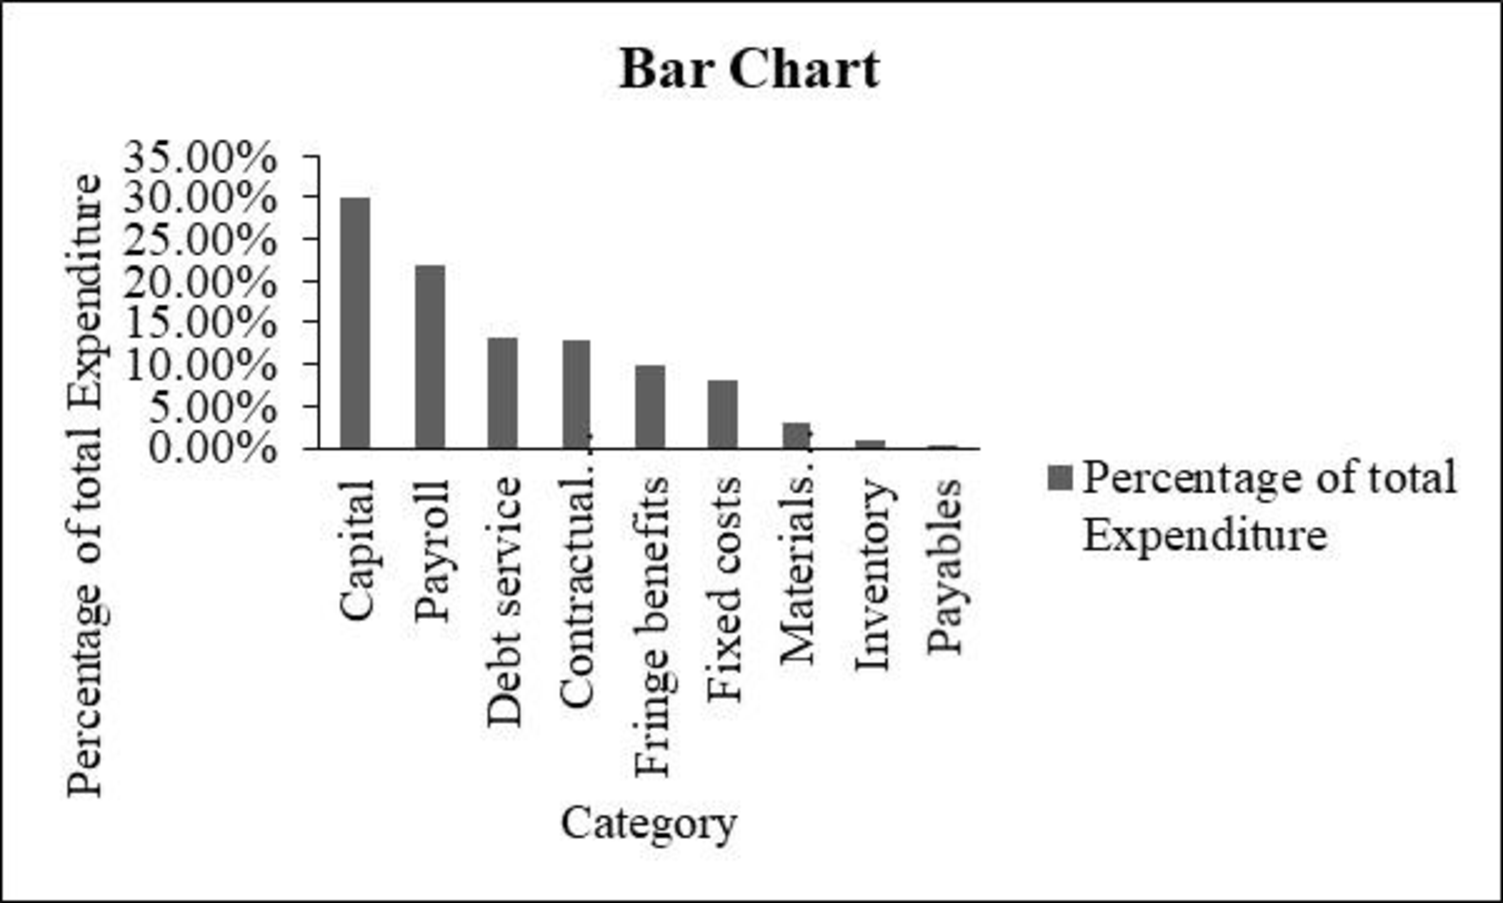
From the obtained table and bar chart, it can be observed that the sum of capital expenditures and payroll contributes 50% of all expenditures.
Also, the total expenditures are over $660 million. Debt service seems to be high, and it is found to be over 10% of total expenditures.
2.
Make tabular displays that show the amount of expenditure by department and percentage of total expenditures by department.
Answer to Problem 3CP
The following table represents the total amount of expenditure by department and percentage of total expenditures by department:
| Department description | Percentage of total expenditure | Total expenditure |
| Department of Police | 9.72% | 64,295,941 |
| Department of Sewers | 8.76% | 57,954,955 |
| Transportation and Engineering | 8.72% | 57,686,199 |
| Department of Fire | 7.23% | 47,838,396 |
| Sewers, Debt Service | 6.59% | 43,585,814 |
| Finance, Risk Management | 5.39% | 35,654,238 |
| SORTA Operations | 3.62% | 23,975,000 |
| Water Works, Debt Service | 3.24% | 21,418,102 |
| Department of Water Works | 3.07% | 20,307,505 |
| Finance, Treasury | 2.80% | 18,531,650 |
| Economic Development | 2.13% | 14,078,735 |
| Division of Parking Facilities | 1.89% | 12,489,731 |
| Community Development, Housing | 1.75% | 11,556,943 |
| Enterprise Technology Solutions | 1.71% | 11,314,215 |
| Public Services, Fleet Services | 1.66% | 10,982,312 |
| Finance, Accounts & Audits | 1.66% | 10,960,345 |
| Transportation and Engineering, Planning | 1.63% | 10,764,138 |
| Public Services, Neighborhood Operations | 1.38% | 9,140,769 |
| Sewers, Millcreek | 1.30% | 8,575,226 |
| Health, Primary Health Care Centers | 1.25% | 8,268,632 |
| Water Works, Water Supply | 1.19% | 7,883,099 |
| Public Services, Facilities Management | 1.13% | 7,469,863 |
| Sewers, Wastewater Administration | 1.01% | 6,668,240 |
| Other department less than 1 percent each | 21.2% | 140,234,644 |
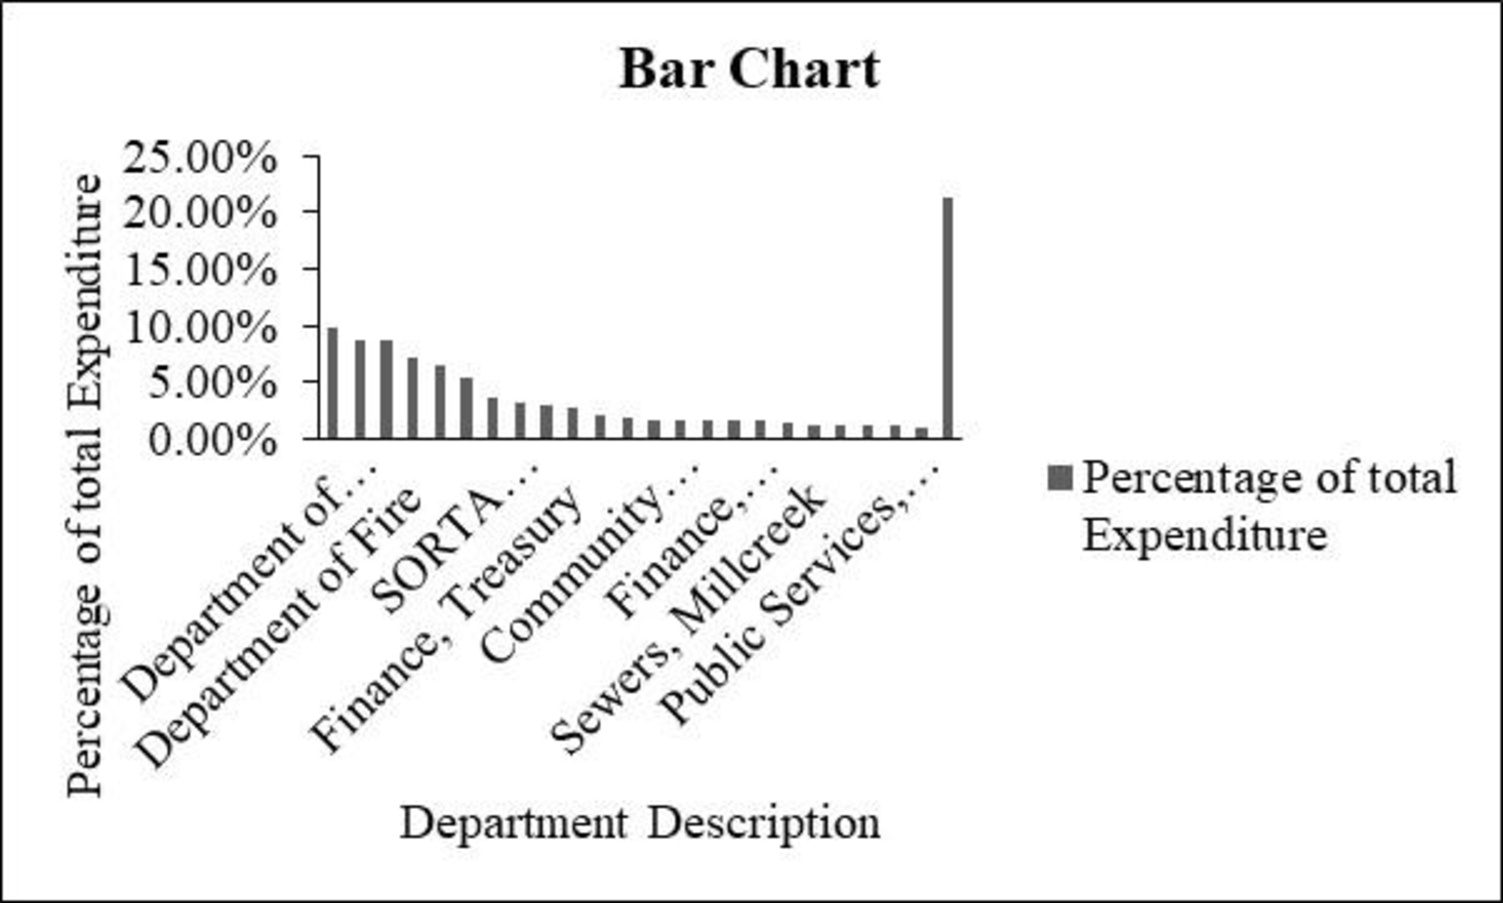
The bar chart for “Department description” is given below:
Explanation of Solution
Calculation:
Here, any departments with less than 1% are combined into a category named “other”.
Department description with less than 1% is tabulated as follows and named as “other”:
| Other (department description less than 1%) | Percentage of total expenditure | Total expenditure |
| Water Works, Distribution | 0.98% | 6,490,554 |
| Public Services, Traffic and Road Operations | 0.89% | 5,884,799 |
| Parks, Administrative and Program Services | 0.87% | 5,744,316 |
| Water Works, Commercial Services | 0.81% | 5,360,380 |
| Sewers, Wastewater Collection | 0.81% | 5,331,756 |
| Sewers, Director/Storm water | 0.79% | 5,213,170 |
| Parks, Operations and Facility Mgmt | 0.76% | 5,008,200 |
| Police Emergency Communications | 0.69% | 4,557,589 |
| Division of Convention Center | 0.67% | 4,460,267 |
| Health, Primary Health Care Programs | 0.58% | 3,821,334 |
| Health, Community Health Services | 0.56% | 3,675,649 |
| Sewers, Maintenance | 0.55% | 3,668,040 |
| Water Works, Water Quality and Treatment | 0.51% | 3,395,988 |
| Recreation, Support Services | 0.50% | 3,315,938 |
| Law Department | 0.47% | 3,078,594 |
| Recreation, Golf | 0.42% | 2,781,652 |
| Water Works, Business Services | 0.41% | 2,693,873 |
| New Construction & Building Standards | 0.40% | 2,677,798 |
| Water Works, Engineering | 0.39% | 2,583,805 |
| Division of Traffic Engineering | 0.38% | 2,504,453 |
| Cincinnati Public School Reserve | 0.38% | 2,500,000 |
| Sewers, Little Miami | 0.37% | 2,439,869 |
| Planning, Licenses & Permits | 0.36% | 2,371,973 |
| Workers' Compensation Insurance | 0.33% | 2,214,094 |
| Motorized and Construction Equipment | 0.33% | 2,187,298 |
| Recreation, Maintenance | 0.33% | 2,162,545 |
| General Fund Overhead | 0.32% | 2,095,756 |
| Health, Primary School &Adolescent | 0.31% | 2,074,254 |
| Community Development Administration | 0.30% | 1,968,773 |
| Sewers, Industrial Waste | 0.28% | 1,841,374 |
| Office of the City Manager | 0.26% | 1,712,437 |
| Sewers, Project Delivery | 0.25% | 1,682,688 |
| Finance, Purchasing | 0.24% | 1,600,148 |
| Recreation, Athletics | 0.24% | 1,582,290 |
| Office of Environmental Qualities | 0.23% | 1,548,437 |
| Recreation, West Region | 0.22% | 1,487,931 |
| Finance, Income Tax | 0.22% | 1,483,479 |
| Health, Commissioner | 0.21% | 1,418,825 |
| Recreation, Central Region | 0.21% | 1,393,663 |
| Recreation, East Region | 0.20% | 1,350,682 |
| Community Development | 0.20% | 1,337,001 |
| Sewers, Muddy Creek | 0.18% | 1,211,584 |
| Health, Technical Resources | 0.17% | 1,122,229 |
| Sewers, Planning | 0.17% | 1,092,095 |
| Enterprise Software and Licenses | 0.16% | 1,082,024 |
| Water Works, IT | 0.16% | 1,039,488 |
| Sewers, Wastewater Engineering | 0.15% | 973,882 |
| Department of Human Resources | 0.14% | 929,460 |
| Department Of Planning & Buildings | 0.14% | 911,988 |
| Office and Technical Equipment | 0.13% | 863,762 |
| Bond Fund — Principal and Interest | 0.12% | 774,523 |
| Sewers, Sycamore | 0.11% | 754,132 |
| Transportation and Engineering Director | 0.11% | 720,092 |
| Division of Aviation | 0.11% | 702,480 |
| Budget & Evaluation | 0.08% | 562,270 |
| Sewers, Polk Run | 0.08% | 532,890 |
| Sewers, Taylor Creek | 0.08% | 529,774 |
| Citizens' Complaint Authority | 0.07% | 431,449 |
| Sewers, Superintendent | 0.06% | 428,268 |
| Contribution to Fire Pension | 0.06% | 416,783 |
| Contribution to Police Pension | 0.06% | 400,439 |
| Public Services, Director | 0.06% | 397,815 |
| Port Authority Greater Cincinnati Development | 0.05% | 350,000 |
| City Council | 0.05% | 337,658 |
| Hamilton Co. Auditor & Treasurer Fees | 0.05% | 298,758 |
| Office of The Clerk of Council | 0.04% | 293,185 |
| Office of The Mayor | 0.04% | 287,622 |
| Lump Sum Payments | 0.04% | 252,054 |
| Finance Director’s Office | 0.03% | 213,548 |
| County Clerk Fees | 0.03% | 175,000 |
| Public Employees Assistance Program | 0.02% | 161,711 |
| Police and Fire Fighter's Insurance | 0.02% | 115,000 |
| Parks, Office of Director | 0.01% | 94,987 |
| Special Investigations/Studies | 0.01% | 92,210 |
| Councilmember PG Sittenfeld | 0.01% | 77,451 |
| Surplus | 0.01% | 76,091 |
| Councilmember Y. Simpson | 0.01% | 70,985 |
| Councilmember W. Young | 0.01% | 63,012 |
| Councilmember R. Qualls | 0.01% | 62,862 |
| Councilmember C. Seelbach | 0.01% | 60,177 |
| Councilmember Quinlivan | 0.01% | 57,685 |
| Councilmember C. Winburn | 0.01% | 57,654 |
| Downtown Special Improvement District | 0.01% | 56,000 |
| Memberships & Publications | 0.01% | 53,150 |
| Cincinnati Music Hall | 0.01% | 50,000 |
| Election Expense | 0.01% | 46,580 |
| Convention Facility Authority | 0.01% | 45,700 |
| Councilmember C. Thomas | 0.01% | 45,603 |
| Councilmember C. Smitherman | 0.01% | 43,141 |
| Mayor's Office Obligations | 0.01% | 41,194 |
| State Unemployment Comp | 0.00% | 31,671 |
| Manager's Office Obligations | 0.00% | 13,956 |
| Councilmember P. Thomas | 0.00% | 13,168 |
| Judgments Against the City | 0.00% | 7,644 |
| Department of Public Recreation | 0.00% | 5,093 |
| Audit & Examiners Fees | 0.00% | 5,000 |
From the data set, the variable “department description” has 119 different departments, out of which 96 departments’ percentage is less than 1.
Therefore, the following table shows the expenditure of all 119 different departments:
| Department description | Total expenditure |
| Department of Police | 64,295,941 |
| Department of Sewers | 57,954,955 |
| Transportation and Engineering | 57,686,199 |
| Department of Fire | 47,838,396 |
| Sewers, Debt Service | 43,585,814 |
| Finance, Risk Management | 35,654,238 |
| SORTA Operations | 23,975,000 |
| Water Works, Debt Service | 21,418,102 |
| Department of Water Works | 20,307,505 |
| Finance, Treasury | 18,531,650 |
| Economic Development | 14,078,735 |
| Division of Parking Facilities | 12,489,731 |
| Community Development, Housing | 11,556,943 |
| Enterprise Technology Solutions | 11,314,215 |
| Public Services, Fleet Services | 10,982,312 |
| Finance, Accounts & Audits | 10,960,345 |
| Transportation and Engineering, Planning | 10,764,138 |
| Public Services, Neighborhood Operations | 9,140,769 |
| Sewers, Millcreek | 8,575,226 |
| Health, Primary Health Care Centers | 8,268,632 |
| Water Works, Water Supply | 7,883,099 |
| Public Services, Facilities Management | 7,469,863 |
| Sewers, Wastewater Administration | 6,668,240 |
| Other department less than 1 percent each | 140,234,644 |
| Grand Total | 661,634,692 |
The percentage for department description is calculated as the ratio of total expenditure to the grand total of all departments.
Therefore, the following table shows the percentage of amount of all department total expenditure by department:
| Department description | Percentage of total expenditure |
| Department of Police | 9.72% |
| Department of Sewers | 8.76% |
| Transportation and Engineering | 8.72% |
| Department of Fire | 7.23% |
| Sewers, Debt Service | 6.59% |
| Finance, Risk Management | 5.39% |
| SORTA Operations | 3.62% |
| Water Works, Debt Service | 3.24% |
| Department of Water Works | 3.07% |
| Finance, Treasury | 2.80% |
| Economic Development | 2.13% |
| Division of Parking Facilities | 1.89% |
| Community Development, Housing | 1.75% |
| Enterprise Technology Solutions | 1.71% |
| Public Services, Fleet Services | 1.66% |
| Finance, Accounts & Audits | 1.66% |
| Transportation and Engineering, Planning | 1.63% |
| Public Services, Neighborhood Operations | 1.38% |
| Sewers, Millcreek | 1.30% |
| Health, Primary Health Care Centers | 1.25% |
| Water Works, Water Supply | 1.19% |
| Public Services, Facilities Management | 1.13% |
| Sewers, Wastewater Administration | 1.01% |
| Other department less than 1 percent each | 21.2% |
Software procedure:
Step-by-step software procedure to obtain bar chart for department using EXCEL software:
- In Excel sheet, enter Department Description in one column and Percentage of total Expenditure in another column.
- Select the data, and then choose Insert > Insert Column Bar Charts.
- Select Clustered Column under More Column Charts.
Output using the Excel is given below:

Interpretation:
- From the obtained table and bar chart, it can be observed that 96 departments are showing total expenditure less than 1% over 119 departments.
- There are six individual departments, namely police, sewers, transportation and engineering, fire, sewer debt service, and financial/risk management, They have the total expenditure approximately 5 percent and more.
- Further, other department less than 1 percent each seems to be high, in terms of total expenditure percentage.
3.
Make tabular displays that show the amount of expenditure by fund and percentage of total expenditures by fund and combine any department with less than 1% into a category named “other”.
Answer to Problem 3CP
The following table represents the total amount of expenditure by fund and percentage of total expenditures by fund:
| Fund | Total expenditure | Percentage of total expenditure |
| 050 - general fund | 168,607,659 | 25.5% |
| 980 - capital projects | 106,180,470 | 16.0% |
| 701 - metropolitan sewer district of greater Cincinnati | 83,713,741 | 12.7% |
| 704 - metropolitan sewer district capital improvements | 57,954,955 | 8.8% |
| 101 - water works | 52,292,202 | 7.9% |
| 711 - risk management | 32,380,425 | 4.9% |
| 759 - income tax - transit | 24,239,259 | 3.7% |
| 151 - bond retirement - city | 15,584,916 | 2.4% |
| 202 - fleet services | 10,994,649 | 1.7% |
| 898 - water works improvement 12 | 8,483,304 | 1.3% |
| 897 - water works improvement 11 | 8,434,379 | 1.3% |
| 302 - income tax - infrastructure | 7,102,773 | 1.1% |
| other (less than 1% each) | 8,56,65,960 | 12.9% |
| Grand Total | 661,634,693 | 100.0% |
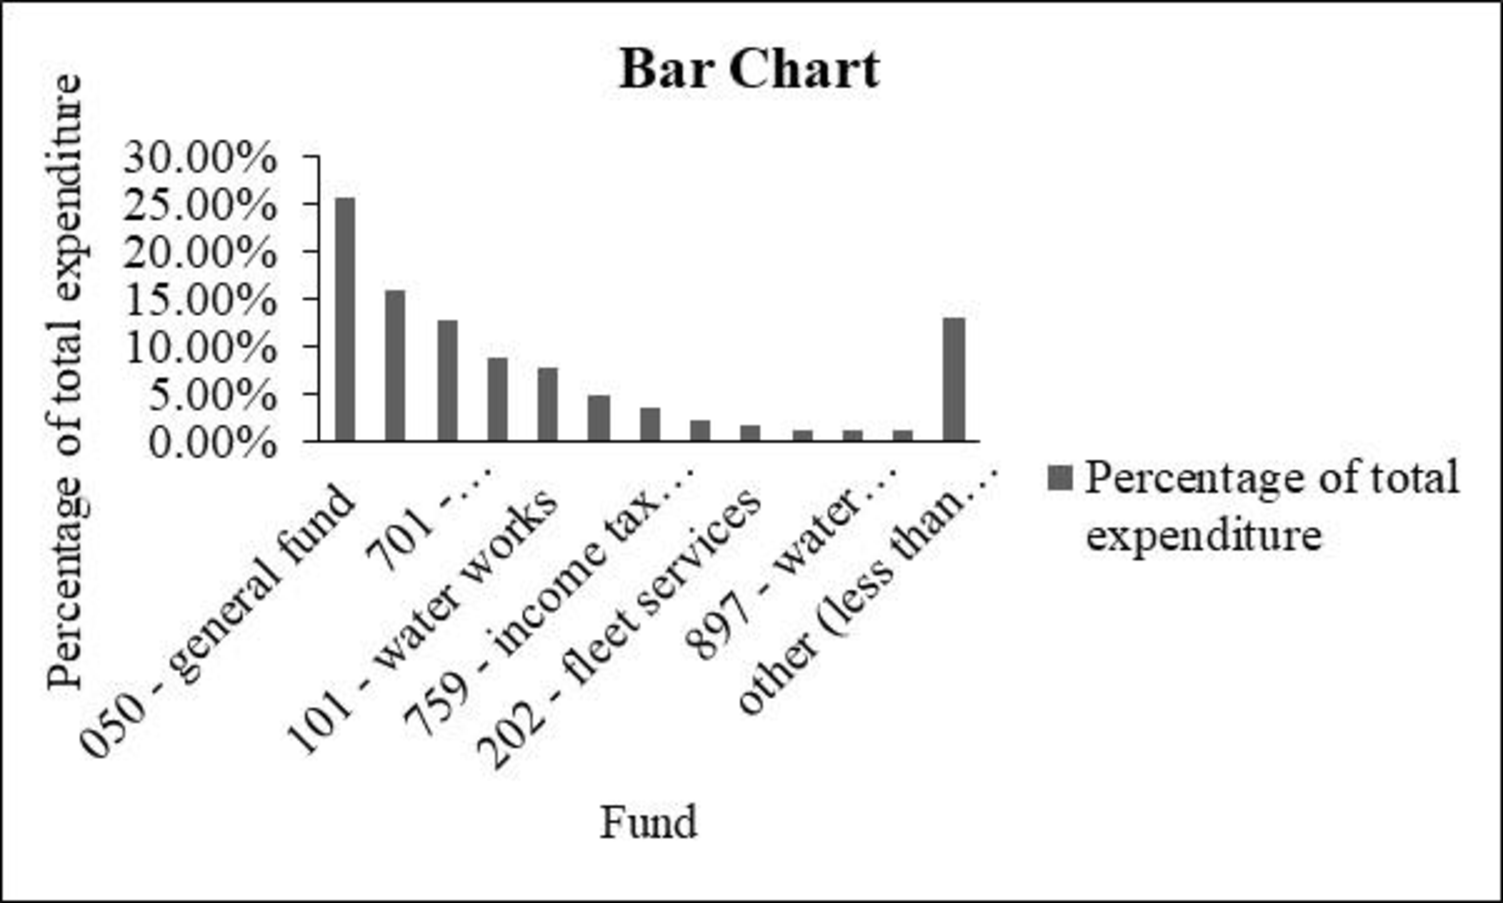
The bar chart for “Fund” is given below:
Explanation of Solution
Calculation:
Fund with less than 1% is tabulated below and named as “other”:
| Other (Fund less than 1%) | Total expenditure | Percentage of total expenditure |
| 155 – u square revenue bonds -trustee | 4,748,810 | 0.80% |
| 304 - community development block grant | 4,696,312 | 0.70% |
| 301 - street construction, maintenance and repair | 4,053,506 | 0.70% |
| 103 - duke energy convention center | 3,508,157 | 0.60% |
| 102 - parking system facilities | 3,388,305 | 0.50% |
| 702 - enterprise technology solutions | 3,216,237 | 0.50% |
| 762 - urban redevelopment tax increment equivalent | 2,816,029 | 0.50% |
| 105 - municipal golf activities | 2,596,303 | 0.40% |
| 395 - health services | 2,411,634 | 0.40% |
| 107 – storm water management | 2,325,888 | 0.40% |
| 368 - law enforcement grant | 2,222,595 | 0.40% |
| 410 - shelter plus care program | 2,162,535 | 0.30% |
| 449 - Cincinnati area’s geographic information system (cagis) | 2,159,283 | 0.30% |
| 353 - home health services | 2,099,548 | 0.30% |
| 457 - clear fund | 1,957,914 | 0.30% |
| 213 - worker's compensation | 1,817,200 | 0.30% |
| 758 - income tax permanent improvement fund | 1,766,123 | 0.30% |
| 214 - water works stores - chemicals | 1,526,281 | 0.30% |
| 204 - water works stores - materials | 1,506,447 | 0.20% |
| 391 - women and infants food grant program | 1,426,434 | 0.20% |
| 472 - fire grants | 1,362,498 | 0.20% |
| 307 - convention center expansion tax | 1,296,800 | 0.20% |
| 212 - employee safety and risk management | 1,216,265 | 0.20% |
| 491 - municipal public improvement equivalent fund | 1,212,813 | 0.20% |
| 438 - neighborhood stabilization program | 1,211,603 | 0.20% |
| 795 - downtown special improvement district | 1,202,786 | 0.20% |
| 201 - printing services/ stores | 1,141,805 | 0.20% |
| 306 - municipal motor vehicle license tax | 1,077,283 | 0.20% |
| 323 - recreation special activities | 1,069,119 | 0.20% |
| 411 - home investment trust | 991,223 | 0.20% |
| 349 - urban renewal debt retirement | 979,853 | 0.10% |
| 350 - public health research | 851,919 | 0.10% |
| 418 - federal health program income | 848,578 | 0.10% |
| 792 - forestry | 740,592 | 0.10% |
| 340 - centennial operations | 724,704 | 0.10% |
| 757 - miscellaneous permanent improvement fund | 662,729 | 0.10% |
| 104 - lunken airport | 586,663 | 0.10% |
| 487 - cuf/heights equivalent fund | 562,261 | 0.10% |
| 483 - downtown/otr east equivalent fund | 558,694 | 0.10% |
| 156 - fountain square west revenue bonds - trustee | 557,577 | 0.10% |
| 412 - food service license fees | 550,645 | 0.10% |
| 369 - criminal activity forfeiture - state | 523,925 | 0.10% |
| 488 –Coryville equivalent fund | 519,767 | 0.10% |
| 502 - arra federal grants | 509,814 | 0.10% |
| 445 - emergency shelter | 453,541 | 0.10% |
| 465 - housing opportunities for persons with aids | 373,929 | 0.10% |
| 498 –Madisonville equivalent fund | 363,449 | 0.10% |
| 332 - krohn conservatory | 302,862 | 0.10% |
| 364 - 911 cell phone fees | 299,652 | 0.00% |
| 381 - Cincinnati abatement project | 284,022 | 0.00% |
| 317 - urban development - property operations | 228,247 | 0.00% |
| 461 - fema grant | 219,424 | 0.00% |
| 793 - boulevard light energy and maintenance (blem) | 183,378 | 0.00% |
| 324 - recreation federal grant projects | 178,387 | 0.00% |
| 166 - greeters revenue bonds - trustee | 176,113 | 0.00% |
| 326 - park donations and special activity | 171,770 | 0.00% |
| 210 - highway maintenance stores | 169,814 | 0.00% |
| 342 - new city buildings operations | 167,023 | 0.00% |
| 420 - public employee assistance program | 165,141 | 0.00% |
| 446 - health network | 164,337 | 0.00% |
| 209 - property management | 162,435 | 0.00% |
| 618 - towing charges - private operators | 150,000 | 0.00% |
| 314 - special events | 146,679 | 0.00% |
| 481 - downtown south/riverfront equivalent fund | 144,066 | 0.00% |
| 367 - criminal activity forfeiture - federal | 131,116 | 0.00% |
| 753 - expressways/gateways | 126,717 | 0.00% |
| 486 - east walnut hills equivalent fund | 125,855 | 0.00% |
| 499 - Oakley equivalent fund | 123,924 | 0.00% |
| 436 - environmental studies | 122,482 | 0.00% |
| 318 - sawyer point | 115,771 | 0.00% |
| 330 - park lodge/pavilion deposits | 102,413 | 0.00% |
| 482 - downtown/otr west equivalent fund | 97,418 | 0.00% |
| 756 - water works capital | 78,225 | 0.00% |
| 485 - walnut hills equivalent fund | 77,402 | 0.00% |
| 207 - recreation stores | 76,091 | 0.00% |
| 161 - msd debt service - trustee - multi series | 71,262 | 0.00% |
| 752 - park board | 69,499 | 0.00% |
| 415 - immunization action plan | 63,781 | 0.00% |
| 478 - justice assistance grant | 56,049 | 0.00% |
| 425 - heart health in hamilton county project | 48,994 | 0.00% |
| 387 - lead hazard control research grant | 48,025 | 0.00% |
| 791 - sidewalks | 45,700 | 0.00% |
| 715 - convention facility authority | 44,830 | 0.00% |
| 454 –metropolitan medical response | 42,877 | 0.00% |
| 428 - urban forestry | 41,771 | 0.00% |
| 448 - health care services for the homeless | 41,475 | 0.00% |
| 370 - drug offender fines | 39,325 | 0.00% |
| 363 - solid waste disposal control | 38,714 | 0.00% |
| 490 - Evanston equivalent fund | 37,825 | 0.00% |
| 354 - household sewage treatment fees | 35,989 | 0.00% |
| 380 - lead poisoning control | 35,194 | 0.00% |
| 394 - state health program income | 29,632 | 0.00% |
| 413 - swimming pool license fees | 26,801 | 0.00% |
| 476 - uasi grant | 25,094 | 0.00% |
| 405 - market facilities | 24,099 | 0.00% |
| 389 - communications and marketing activities | 22,805 | 0.00% |
| other (less than 1% each) | 85,665,960 | 12.9% |
From the above table, the other category has the total expenditure of $85,665,960.
Therefore, the following table shows the amount of all 13 entities’ total expenditure by fund:
| Fund | Total expenditure |
| 050 - general fund | 168,607,659 |
| 980 - capital projects | 106,180,470 |
| 701 - metropolitan sewer district of greater Cincinnati | 83,713,741 |
| 704 - metropolitan sewer district capital improvements | 57,954,955 |
| 101 - water works | 52,292,202 |
| 711 - risk management | 32,380,425 |
| 759 - income tax – transit | 24,239,259 |
| 151 - bond retirement – city | 15,584,916 |
| 202 - fleet services | 10.994,649 |
| 898 - water works improvement 12 | 8,483,304 |
| 897 - water works improvement 11 | 8,434,379 |
| 302 - income tax – infrastructure | 7,102,773 |
| other (less than 1% each) | 85,665,960 |
| Total | 661,634,693 |
The percentage for fund is calculated as the ratio of total expenditure to the grand totals all funds.
Therefore, the following table shows the percentage of amount of all funds’ total expenditure by funds:
| Fund | Percentage of total expenditure |
| 050 - general fund | 25.5% |
| 980 - capital projects | 16.0% |
| 701 - metropolitan sewer district of greater Cincinnati | 12.7% |
| 704 - metropolitan sewer district capital improvements | 8.8% |
| 101 - water works | 7.9% |
| 711 - risk management | 4.9% |
| 759 - income tax - transit | 3.7% |
| 151 - bond retirement - city | 2.4% |
| 202 - fleet services | 1.7% |
| 898 - water works improvement 12 | 1.3% |
| 897 - water works improvement 11 | 1.3% |
| 302 - income tax - infrastructure | 1.1% |
| other (less than 1% each) | 12.9% |
| Total | 100.0% |
Software procedure:
Step-by-step software procedure to obtain bar chart for fund using Excel:
- In Excel sheet, enter Fund in one column and Percentage of total Expenditure in another column.
- Select the data, and then choose Insert > Insert Column Bar Charts.
- Select Clustered Column under More Column Charts.
Output using Excel is given below:

Interpretation:
- From the obtained table and bar chart, it can be observed that the fund category 050-General fund seems to be high, in terms of total expenditure percentage.
Want to see more full solutions like this?
Chapter 2 Solutions
Essentials Of Statistics For Business & Economics


- Cholesterol Cholesterol in human blood is necessary, but too much can lead to health problems. There are three main types of cholesterol: HDL (high-density lipoproteins), LDL (low-density lipoproteins), and VLDL (very low-density lipoproteins). HDL is considered “good” cholesterol; LDL and VLDL are considered “bad” cholesterol. A standard fasting cholesterol blood test measures total cholesterol, HDL cholesterol, and triglycerides. These numbers are used to estimate LDL and VLDL, which are difficult to measure directly. Your doctor recommends that your combined LDL/VLDL cholesterol level be less than 130 milligrams per deciliter, your HDL cholesterol level be at least 60 milligrams per deciliter, and your total cholesterol level be no more than 200 milligrams per deciliter. (a) Write a system of linear inequalities for the recommended cholesterol levels. Let x represent the HDL cholesterol level, and let y represent the combined LDL VLDL cholesterol level. (b) Graph the system of inequalities from part (a). Label any vertices of the solution region. (c) Is the following set of cholesterol levels within the recommendations? Explain. LDL/VLDL: 120 milligrams per deciliter HDL: 90 milligrams per deciliter Total: 210 milligrams per deciliter (d) Give an example of cholesterol levels in which the LDL/VLDL cholesterol level is too high but the HDL cholesterol level is acceptable. (e) Another recommendation is that the ratio of total cholesterol to HDL cholesterol be less than 4 (that is, less than 4 to 1). Identify a point in the solution region from part (b) that meets this recommendation, and explain why it meets the recommendation.arrow_forwardThe file MidCity Download MidCitycontains data on 128 recent sales in Mid City. For each sale, the file shows the neighborhood (1, 2, or 3) in which the house is located, the number of offers made on the house, the square footage, whether the house is made primarily of brick, the number of bathrooms, the number of bedrooms, and the selling price. Neighborhoods 1 and 2 are more traditional neighborhoods, whereas neighborhood 3 is a newer, more prestigious neighborhood. PROBLEM 1: Construct 3 different confidence intervals. Part A) Sort and filter the data from the MidCity file so that you only consider the data from neighborhood 1. Construct a 99% confidence interval for the square footage of all homes in neighborhood 1. Make sure you list the specific equations you are using, ALL variables, show ALL work etc., in your report. You can use Excel to complete all computations. Remember to interpret these confidence intervals in the context of this problem. Use one Excel spreadsheet…arrow_forwardSeparation refers to an employee who has left a business, whether the employee has quit or was fired. Employment records for three businesses are as follows: Gizmo Inc.: 700 employees, 56 separations; WidgeCo: 1,800 employees, 108 separations; Techno Builders: 1,200 employees, 78 separations. Calculate their employee turnover rate percentages. Why would these numbers be useful to human resource people? Turnover rate = Number of separations ÷ Number of employees Turnover rates: Gizmo Inc.= ________ WidgeCo = __________ Techno Builders = ________ Company with highest rate: _____________ Lowest rate: ___________arrow_forward
- Compare and contrast the three types of responsibility centers. What is the best way to evaluate a manager's performance in each type of center? What is the problem with using only financial measures of performance?arrow_forwardGiven that sales volumes are forecast to stay steady at 2,000,000 units, the best option is _________________. Group of answer choices 1. Manual Production Line 2. Semi-automatic Production Line 3. Fully Automatic Production Linearrow_forwardArianna Estefan manages Salmon Falls Park, which has two flagship roller coasters, the Flyer and the Destroyer. When Arianna walks around the park during hours of operation, she notices that there are fewer people waiting in line for the Flyer than for the Destroyer. Since both roller coasters have similar capacities and similar run times, both roller coasters should have about the same number of riders. Based on the anecdotal evidence, Arianna claims that the population mean number of riders per hour on the Flyer is less than the population mean number of riders per hour on the Destroyer. Arianna reviews data collected in the past and assumes that the population standard deviation is 48.29 for the Flyer and 51.86 for the Destroyer. Arianna randomly selects hours during which the attendant of each ride counts the number of riders. The sampling occurs over the course of several weeks. The results are provided in the table shown below. Assuming the conditions needed for the hypothesis…arrow_forward
- Arianna Estefan manages Salmon Falls Park, which has two flagship roller coasters, the Flyer and the Destroyer. When Arianna walks around the park during hours of operation, she notices that there are fewer people waiting in line for the Flyer than for the Destroyer. Since both roller coasters have similar capacities and similar run times, both roller coasters should have about the same number of riders. Based on the anecdotal evidence, Arianna claims that the population mean number of riders per hour on the Flyer is less than the population mean number of riders per hour on the Destroyer. Arianna reviews data collected in the past and assumes that the population standard deviation is 48.29 for the Flyer and 51.86 for the Destroyer. Arianna randomly selects hours during which the attendant of each ride counts the number of riders. The sampling occurs over the course of several weeks. The results are provided in the table shown below. Assuming the conditions needed for the hypothesis…arrow_forwardDave Fletcher, the general manager of North Carolina Engineering Corporation (NCEC), thinks that his firm’s engineer-ing services contracted to highway construction firms are directly related to the volume of highway construction business contractedwith companies in his geographic area. He wonders if this is reallyso, and if it is, can this information help him plan his operationsbetter by forecasting the quantity of his engineering servicesrequired by construction firms in each quarter of the year? Thefollowing table presents the sales of his services and total amountsof contracts for highway construction over the past eight quarters: a) Using this data, develop a regression equation for predictingthe level of demand of NCEC’s services. b) Determine the coefficient of correlation and the standard errorof the estimate.arrow_forwardFull time year around median salary for u.s men in 2010 was 41,300 and the full time year round salary for u.s women in 2010 was 34,000 The full time year round median salary for u.s men in 2010 was ___% of the full time year round median salary for u.s women in 2010arrow_forward
- ncur Technologies, Inc., is a large expense-management company located inRedmond, Washington. The Wall street Journal asked Concur to examine the datafrom 8.3 million expense reports to provide insights regarding business travelexpenses. Their analysis of the data showed that New York was the most expensivecity, with an average daily hotel room rate of $198 and an average amount spent onentertainment, including group meals and tickets for shows, sports, and other events,of $172. In comparison, the U.S. averages for these two categories were $89 for theroom rate and $99 for entertainment. The following table shows the average dailyhotel room rate and the amount spent on entertainment for a random sample of 9 ofthe 25 most visited U.S. cities (The Wall street Journal, August 18, 2011).CityRoom Rate($)Entertainment($)Boston 148 161Denver 96 105Nashville 91 101New Orleans 110 142Phoenix 90 100San Diego 102 120San Francisco 136 167San Jose 90 140Tampa 82 98a. Develop a scatter diagram for…arrow_forwardcreate a data set and answer the above questionarrow_forward

 Glencoe Algebra 1, Student Edition, 9780079039897...AlgebraISBN:9780079039897Author:CarterPublisher:McGraw Hill