SAT Scores. The SAT is a standardized test used by many colleges and universities in their admission decisions. More than one million high school students take the SAT each year. The current version of the SAT includes three parts: reading comprehension, mathematics, and writing. A perfect combined score for all three parts is 2400. A sample of SAT scores for the combined three-part SAT are as follows:
- a. Show a frequency distribution and histogram. Begin with the first class starting at 800 and use a class width of 200.
- b. Comment on the shape of the distribution.
- c. What other observations can be made about the SAT scores based on the tabular and graphical summaries?
a.

Construct the frequency distribution and histogram for the data.
Answer to Problem 44SE
The frequency distribution is tabulated below:
Class | Tally | Frequency |
800-999 | 1 | |
1000-1199 | 3 | |
1200-1399 | 6 | |
1400-1599 | 10 | |
1600-1799 | 7 | |
1800-1999 | 2 | |
2000-2199 | 1 | |
Total | 30 |
- Output using EXCEL is given below:
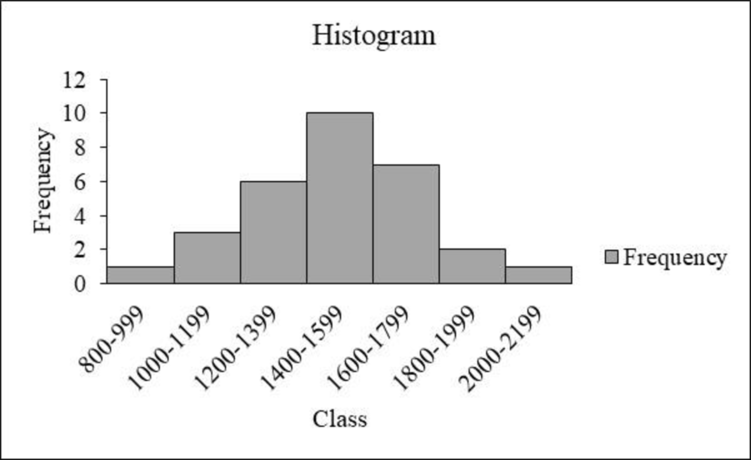
Explanation of Solution
Calculation:
The data represent the sample of SAT scores for the combined three part sat scores.
The frequencies are calculated using the tally mark and the method of grouping is also used because the range of the data is from 800 to 2,199. Here, the number of times each class level repeats is the frequency of that particular class.
- From the given data set, it is given that the class should be approximately started from 800 with the class width of 200.
- Make a tally mark for each value in the corresponding class and continue for all the values in the data.
- The number of tally marks in each class represents the frequency f of that class.
Similarly, the frequency of the remaining classes for the data set is given below:
Class | Tally | Frequency |
800-999 | 1 | |
1000-1199 | 3 | |
1200-1399 | 6 | |
1400-1599 | 10 | |
1600-1799 | 7 | |
1800-1999 | 2 | |
2000-2199 | 1 | |
Total | 30 |
Software procedure:
Step-by-step procedure to draw the frequency histogram chart using EXCEL software:
- In Excel sheet, enter Class in one column and Frequency in another column.
- Select the data and then choose Insert > Insert Column Bar Charts.
- Select Clustered Column Under More Column Charts.
- Double click the bars
- In Format Data Series, enter 0 in Gap Width under Series Options.
b.

Comment the shape of the distribution.
Answer to Problem 44SE
The distribution of sat score is approximately symmetric.
Explanation of Solution
Symmetric distribution:
When the left and right sides of the distribution are approximately equal or mirror images of each other, then the distribution is called as a symmetric distribution. A symmetric distribution can be U shaped or bell shaped.
From the graph, it is observed that the left and right sides of the histogram are approximately equal. In addition, the shape of the distribution is a bell-shaped curve.
Thus, it can be concluded that the distribution is approximately symmetric.
c.

Comment the observations of sat scores based on the tabular and graphical summary.
Explanation of Solution
- From the data and the histogram, it is observed that approximately 33 percent of sat score (frequency about 10 of 30) lie between 1,400 and 1,599, which is modal class of the distribution. The average value of sat scores is 1,500.
- Moreover, the scores, which are less than 800 or greater than 2,200, are unusual.
Want to see more full solutions like this?
Chapter 2 Solutions
Essentials Of Statistics For Business & Economics
- Determine whether a probability distribution exists. If a probability distribution exists, find its mean and standard deviation. If a probability distribution does not exist, identify the requirements that are not met. Fun Ways to Flirt A sociologist randomly selects single adults into groups of three, and the random variable x is the number of people in the group who say the most fun way to flirt is in person (based on a Microsoft instant messenger survey). P(x) 0 0.091 1 0.334 2 0.408 3 0.166arrow_forwardDetermine whether a probability distribution exists. If a probability distribution exists, find its mean and standard deviation. If a probability distribution does not exist, identify the requirements that are not met. Fun Ways to Flirt In a Microsoft Instant Messenger survey, respondents were asked to choose the funniest way to flirt, and the attached table is based on the results. P(x) Email 0.06 In person 0.55 Instant message 0.24 Text message 0.15arrow_forwardIn an electrical products industry, as part of a quality control test, a batch of 300 electrical fuses is selected, which is known to contain 5% defective fuses. A sample of 5 fuses is taken to verify their condition. Determine the probability that: a) One fuse is defective b) Two fuses are defective c) At least one is defective d) All five are defective e) Construct the probability distribution grapharrow_forward
- Answer the problem please.arrow_forwardcan wr define each section pleasearrow_forwardA number of years ago, there was a popular television game show called Let's Make a Deal. The host, Monty Hall, would randomly select contestants from the audience and, as the title suggests, he would make deals for prizes. Contestants would be given relatively modest prizes and then would be offered the opportunity to risk that prize to win better ones. Suppose a contestant on this show, On the stage are three curtains, A, B, and C. Behind one of them is a brand-new car worth $45,000. Behind the other two curtains, the stage is empty.mthey must now select one of the curtains. Suppose you select Curtain A.In an attempt to make things more interesting, Monty then exposes an empty stage by opening Curtain C (note: he knows that there is nothing behind Curtain C). He then asks if they want to keep Curtain A, or switch to Curtain B.What should they do? Keep Curtain A or switch to Curtain B?arrow_forward
- > than m... 1/5 Saray A binomial experiment with probability of success p=0.16 and = 7 trials is conducted. What is the probability that the experiment results in more than 1 success? Do not round your intermediate computations, and round your answer to three decimal places. (If necessary, consult a list of formulas.) o search E C 105°F E Explanation Check 2025 McGraw Hill LLC. All Rights Reserved. Terms of Use | Privacy Center | Accessibilityarrow_forwardfind an article that includes a reference to the use of probability in a real life situation. These articles/videos might be discussing weather events, investing outcomes, or sports performance, among many other possible topicsarrow_forwardGood Day, Kindly assist with this query. Any assistance would be appreciated. Compute R2 Is the latter significant different from zero?arrow_forward
- The following table describes the probability distribution of the number of Mexican-Americans serving on a 12-member jury in Hidalgo County, Texas. Assuming we repeat the random selection process for the 12 jurors and count the number of Mexican-Americans each time, calculate the mean number of Mexican-Americans (out of 12), the variance, and the standard deviation. Use these results and the interval rule of thumb to calculate the highest common value and the lowest common value. Based on the results, determine whether a jury consisting of 7 Mexican-Americans out of 12 jurors is common or uncommon. Probability distribution: probabilities of numbers of Mexican-Americans on a 12-member jury, assuming the members are randomly selected from a population in which 80% of the inhabitants are Mexican-American x (méxico- estadouni- P(x) denses) 0 0+ 1 0+ 2 0+ 3 0+ 4 0.001 5 0.003 6 0.016 7 0.053 8 0.133 9 0.236 10 0.283 11 0.206 12 0.069arrow_forwarda) When two variables are correlated, can the researcher be sure that one variable causes the other? If YES , why? If NO , why? b) What is meant by the statement that two variables are related? Discuss with examples.arrow_forwardGood Day, assist me with plotting the following. I've already calculated the System Average Interruption Duration Index and System Average Interruption Frequency Index. using this data Create time series plots form the reliability metrics SAIDI and SAIFI along with thetrend lines based on the linear regression SAIDI(MINUTES) SAIFI(Interruptions) 2.58 0.045 2.94 0.056 2.32 0.056 3.21 0.177 2.78 0.180 2.72 0.121 2.44 0.119 3.19 0.175 2.21 0.065 2.30 0.135 3.49 0.128 3.60 0.112 2.15 0.104 3.75 0.055 3.12 0.036 2.85 0.123 2.62 0.173 3.08 0.047 1.92 0.040 2.94 0.147arrow_forward
- Holt Mcdougal Larson Pre-algebra: Student Edition...AlgebraISBN:9780547587776Author:HOLT MCDOUGALPublisher:HOLT MCDOUGALGlencoe Algebra 1, Student Edition, 9780079039897...AlgebraISBN:9780079039897Author:CarterPublisher:McGraw Hill
- Big Ideas Math A Bridge To Success Algebra 1: Stu...AlgebraISBN:9781680331141Author:HOUGHTON MIFFLIN HARCOURTPublisher:Houghton Mifflin HarcourtCollege Algebra (MindTap Course List)AlgebraISBN:9781305652231Author:R. David Gustafson, Jeff HughesPublisher:Cengage Learning