STATISTICS F/BUSINESS+ECONOMICS-TEXT
13th Edition
ISBN: 9781305881884
Author: Anderson
Publisher: CENGAGE L
bartleby

Concept explainers

bartleby

Videos

Textbook Question
100%
Book Icon
Chapter 2, Problem 44SE

Approximately 1.5 million high school students take the SAT each year and nearly 80% of the college and universities without open admissions policies use SAT scores in making admission decisions (College Board, March 2009). The current version of the SAT includes three parts: reading comprehension, mathematics, and writing. A perfect combined score for all three parts is 2400. A sample of SAT scores for the combined three-part SAT are as follows:

Chapter 2, Problem 44SE, Approximately 1.5 million high school students take the SAT each year and nearly 80% of the college

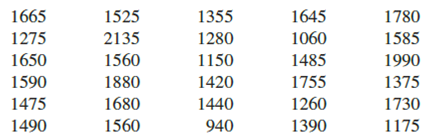
  1. a. Show a frequency distribution and histogram. Begin with the first class starting at 800 and use a class width of 200.
  2. b. Comment on the shape of the distribution.
  3. c. What other observations can be made about the SAT scores based on the tabular and graphical summaries?

a.

Expert Solution
Check Mark
To determine

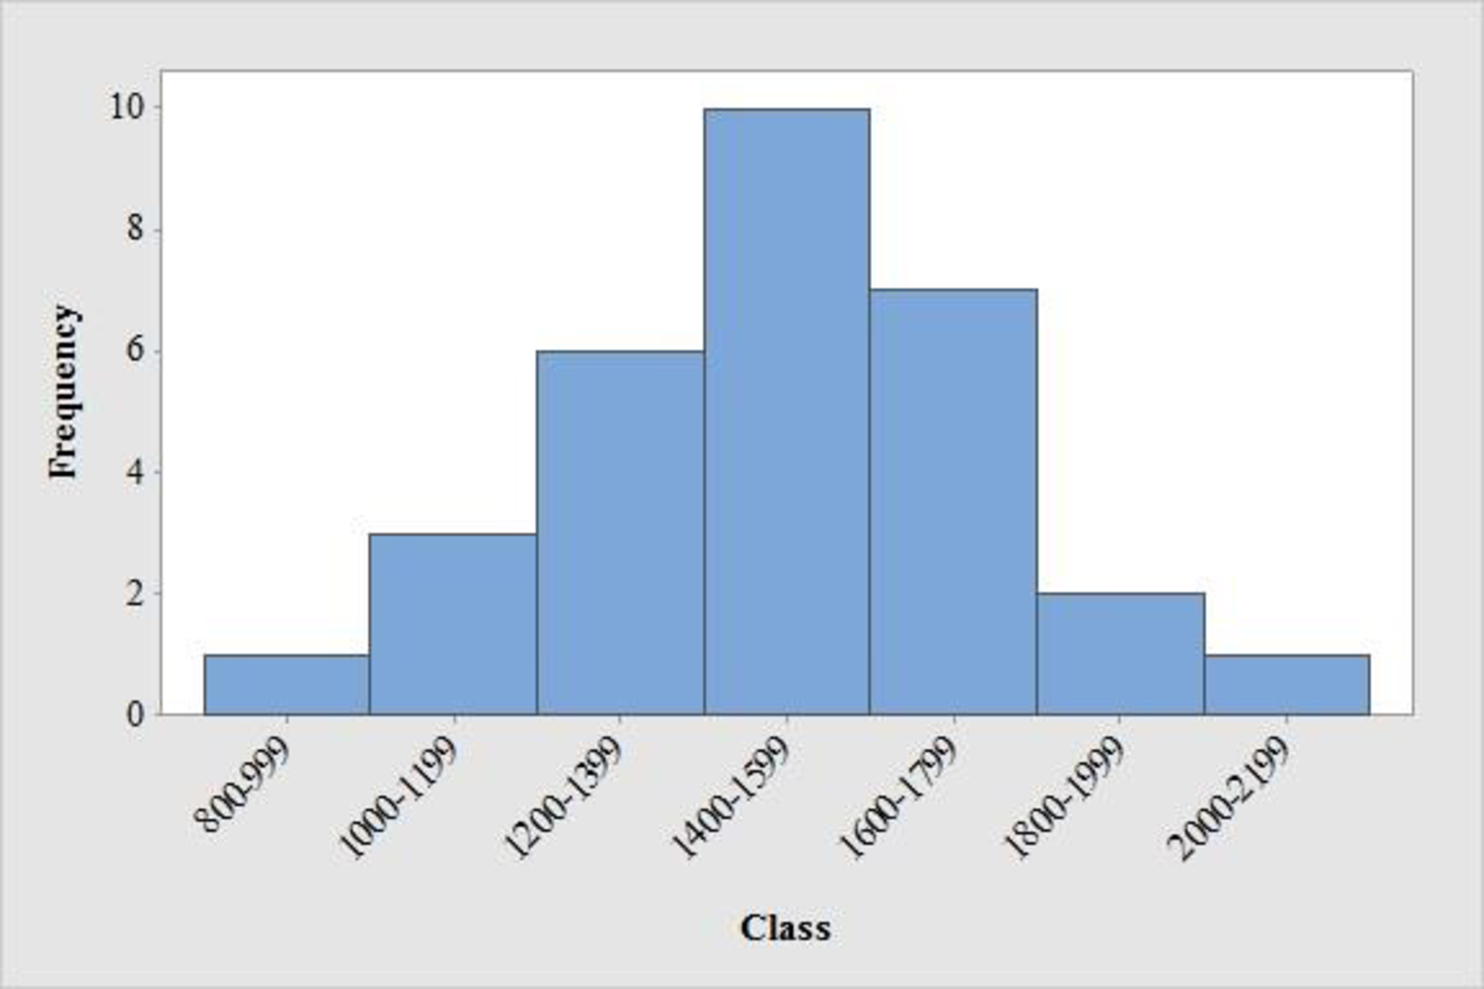
Construct the frequency distribution and histogram for the data.

Answer to Problem 44SE

The frequency distribution is tabulated below:

ClassTallyFrequency
800-999|1
1000-1199|||3
1200-1399|||||6
1400-1599||||||||10
1600-1799||||||7
1800-1999||2
2000-2199|1
Total 30
  • Output using MINITAB software is given below:

STATISTICS F/BUSINESS+ECONOMICS-TEXT, Chapter 2, Problem 44SE

Explanation of Solution

Calculation:

The data represents the sample of SAT scores for combined three part sat scores.

The frequencies are calculated by using the tally mark and the method of grouping is used because, range of the data is from 800 to 2,199. Here, the number of times each class levels repeats is the frequency of that particular class.

  • From the given data set it is given that the class should be from approximately started with the class of 800 with class width of about 200.
  • Make a tally mark for each value in the corresponding class and continue for all values in the data.
  • The number of tally marks in each class represents the frequency, f of that class.

Similarly, the frequency of remaining classes for the data set is given below:

ClassTallyFrequency
800-999|1
1000-1199|||3
1200-1399|||||6
1400-1599||||||||10
1600-1799||||||7
1800-1999||2
2000-2199|1
Total 30

Software procedure:

Step by step procedure to draw the frequency histogram chart by using MINITAB software.

  • Choose Graph > Histogram.
  • Choose Simple, and then click OK.
  • In Graph variables, enter the corresponding column of data.
  • In scale on y-axis, make click on frequency.
  • Click on ok.

b.

Expert Solution
Check Mark
To determine

Comment the shape of the distribution.

Answer to Problem 44SE

The distribution of sat score is approximately symmetric.

Explanation of Solution

Symmetric distribution:

When the left and right sides of the distribution are approximately equal or mirror images of each other and three distributions will fall under symmetric distribution that is bell shaped, triangular and uniform or rectangular and then it is symmetric distribution.

From the graph, it is observed that the left and right side of the histogram is approximately equal. Hence, the shape of the distribution is bell-shaped curve.

Thus, it can be concluded that the distribution is approximately symmetric.

c.

Expert Solution
Check Mark
To determine

Comment the observations of sat scores based on the tabular and graphical summary.

Explanation of Solution

From the data and the histogram, it is observed that approximately 33 percent of sat score (frequency about 10 of 30) will lie between 1400 and 1599.

  • Moreover, the score less than 800 or greater than 2,200 are unusual and the average value of sat scores is over 1,500.

Want to see more full solutions like this?

Subscribe now to access step-by-step solutions to millions of textbook problems written by subject matter experts!

Chapter 2 Solutions

STATISTICS F/BUSINESS+ECONOMICS-TEXT

Ch. 2.2 - Consider the following data. a. Develop a...Ch. 2.2 - Consider the following frequency distribution....Ch. 2.2 - Construct a histogram for the data in exercise 12.Ch. 2.2 - Consider the following data. a. Construct a dot...Ch. 2.2 - Construct a stem-and-leaf display for the...Ch. 2.2 - Construct a stem-and-leaf display for the...Ch. 2.2 - Applications A doctors office staff studied the...Ch. 2.2 - CBSSports.com developed the Total Player Ratings...Ch. 2.2 - Based on the tons handled in a year, the ports...Ch. 2.2 - The London School of Economics and the Harvard...Ch. 2.2 - Fortune provides a list of Americas largest...Ch. 2.2 - entrepreneur magazine ranks franchises using...Ch. 2.2 - The DATAfile EngineeringSalary contains the median...Ch. 2.2 - Each year America.EDU ranks the best paying...Ch. 2.2 - The 2011 Cincinnati Flying Pig Half-Marathon (13.1...Ch. 2.3 - The following data are for 30 observations...Ch. 2.3 - The following observations are for two...Ch. 2.3 - The Daytona 500 is a 500-mile automobile race held...Ch. 2.3 - The following crosstabulation shows the average...Ch. 2.3 - Recently, management at Oak Tree Golf Course...Ch. 2.3 - The following crosstabulation shows the number of...Ch. 2.3 - Each year Forbes ranks the worlds most valuable...Ch. 2.3 - Refer to Table 2.12. a. Prepare a crosstabulation...Ch. 2.3 - The U.S. Department of Energys Fuel Economy Guide...Ch. 2.4 - The following 20 observations are for two...Ch. 2.4 - Consider the following data on two categorical...Ch. 2.4 - The following crosstabulation summarizes the data...Ch. 2.4 - A study on driving speed (miles per hour) and fuel...Ch. 2.4 - The Current Results website lists the average...Ch. 2.4 - People often wait until middle age to worry about...Ch. 2.4 - Smartphones are advanced mobile phones with...Ch. 2.4 - The Northwest regional manager of an outdoor...Ch. 2 - Approximately 1.5 million high school students...Ch. 2 - The DATAfile MedianHousehold contains the median...Ch. 2 - Data showing the population by state in millions...Ch. 2 - A startup companys ability to gain funding is a...Ch. 2 - Consumer complaints are frequently reported to the...Ch. 2 - The term Beta refers to a measure of a stocks...Ch. 2 - The U.S. Census Bureau serves as the leading...Ch. 2 - western University has only one womens softball...Ch. 2 - Fortune magazine publishes an annual survey of the...Ch. 2 - Table 2.18 shows a portion of the data for a...Ch. 2 - Refer to the data set in Table 2.18. a. Construct...Ch. 2 - Refer to the data set in Table 2.18. a. Construct...Ch. 2 - Refer to the data set in Table 2.18. a. Prepare a...Ch. 2 - Google has changed its strategy with regard to how...Ch. 2 - A zoo has categorized its visitors into three...Ch. 2 - Pelican Stores Pelican Stores, a division of...Ch. 2 - Motion Picture Industry The motion picture...Ch. 2 - Queen City Cincinnati, Ohio, also known as the...
Knowledge Booster
Background pattern image
Statistics
Learn more about
Need a deep-dive on the concept behind this application? Look no further. Learn more about this topic, statistics and related others by exploring similar questions and additional content below.
Recommended textbooks for you
Text book image
Glencoe Algebra 1, Student Edition, 9780079039897...
Algebra
ISBN:9780079039897
Author:Carter
Publisher:McGraw Hill
Mod-01 Lec-01 Discrete probability distributions (Part 1); Author: nptelhrd;https://www.youtube.com/watch?v=6x1pL9Yov1k;License: Standard YouTube License, CC-BY
Discrete Probability Distributions; Author: Learn Something;https://www.youtube.com/watch?v=m9U4UelWLFs;License: Standard YouTube License, CC-BY
Probability Distribution Functions (PMF, PDF, CDF); Author: zedstatistics;https://www.youtube.com/watch?v=YXLVjCKVP7U;License: Standard YouTube License, CC-BY
Discrete Distributions: Binomial, Poisson and Hypergeometric | Statistics for Data Science; Author: Dr. Bharatendra Rai;https://www.youtube.com/watch?v=lHhyy4JMigg;License: Standard Youtube License