
Videos
To graph: For the antiderivative of
Explanation of Solution
Given information:
The graph of a function is shown in figure (1).
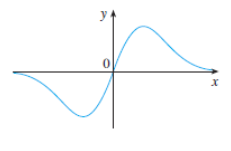
Figure (1)
Graph:
From the given graph it is observed that for all negative values of
This implies its anti-derivative function is decreasing in the interval
For all positive values of
It means that its antiderivative function is increasing in the interval
The graph for the antiderivative of the function is shown in figure (1).
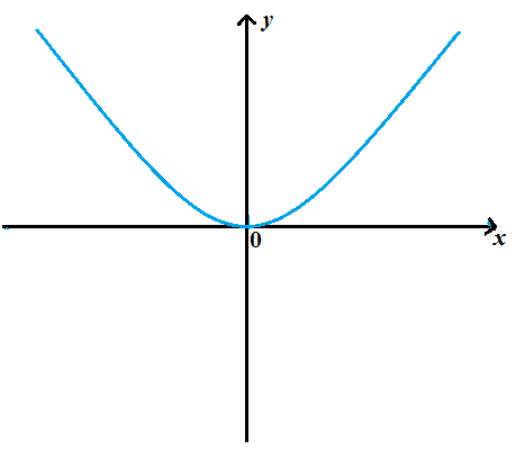
Figure (1)
Interpretation: Graph for theantiderivative of the function is shown in figure (1).
Chapter 2 Solutions
Single Variable Calculus: Concepts and Contexts, Enhanced Edition


 Calculus: Early TranscendentalsCalculusISBN:9781285741550Author:James StewartPublisher:Cengage Learning
 Thomas' Calculus (14th Edition)CalculusISBN:9780134438986Author:Joel R. Hass, Christopher E. Heil, Maurice D. WeirPublisher:PEARSON
 Calculus: Early Transcendentals (3rd Edition)CalculusISBN:9780134763644Author:William L. Briggs, Lyle Cochran, Bernard Gillett, Eric SchulzPublisher:PEARSON
 Calculus: Early TranscendentalsCalculusISBN:9781319050740Author:Jon Rogawski, Colin Adams, Robert FranzosaPublisher:W. H. Freeman
 Calculus: Early Transcendental FunctionsCalculusISBN:9781337552516Author:Ron Larson, Bruce H. EdwardsPublisher:Cengage Learning