
Videos
Refer to the Lincolnville School District bus data. Select the variable referring to the number of miles traveled since the last maintenance, and then organize these data into a frequency distribution.
- a. What is a typical amount of miles traveled? What is the
range ? - b. Comment on the shape of the distribution. Are there any outliers in terms of miles driven?
- c. Draw a cumulative relative frequency distribution. Forty percent of the buses were driven fewer than how many miles? How many buses were driven less than 10,500 miles?
- d. Refer to the variables regarding the bus manufacturer and the bus capacity. Draw a pie chart of each variable and write a description of your results.
a.
Obtain a frequency distribution for the variable Team salary.
Find the typical amount of miles travelled.
Find the range of the miles.
Answer to Problem 53DA
The frequency distribution for the salary is given below:
| Miles | Frequency |
Cumulative frequency |
| 9,900-10,200 | 8 | 8 |
| 10,200-10,500 | 8 | 16 |
| 10,500-10,800 | 11 | 27 |
| 10,800-11,100 | 8 | 35 |
| 11,100-11,400 | 13 | 48 |
| 11,400-11,700 | 12 | 60 |
| 11,700-12,000 | 20 | 80 |
| Total | 80 |
The typical mile driven is about 11,100 miles.
The range of the salaries is 2,100 miles.
Explanation of Solution
Selection of the number of classes:
The “2 to the k rule” suggests that the number of classes is the smallest value of k, where
It is given that the data set consists of 80 observations. The value of k can be obtained as follows:
Here,
Therefore, the number of classes for the given data set is 7.
From the data set, the maximum and minimum values are 11,973 and 10,000, respectively.
The formula for the class interval is given as follows:
Where, i is the class interval and k is the number of classes.
Therefore, the class interval for the given data can be obtained as follows:
In practice, the class interval size is usually rounded up to some convenient number. Therefore, the reasonable class interval is 300.
Frequency distribution:
The frequency table is a collection of mutually exclusive and exhaustive classes, which shows the number of observations in each class.
Since the minimum value is 10,000 and the class interval is 300, the first class would be 9,900-10,200. The frequency distribution for miles can be constructed as follows:
| Miles | Frequency |
Cumulative frequency |
| 9,900-10,200 | 8 | 8 |
| 10,200-10,500 | 8 | |
| 10,500-10,800 | 11 | |
| 10,800-11,100 | 8 | |
| 11,100-11,400 | 13 | |
| 11,400-11,700 | 12 | |
| 11,700-12,000 | 20 | |
| Total | 80 |
From the above frequency distribution, the typical miles driven is about 11,100 miles.
The range of miles is from 12,000 to 9,900 million dollars. Thus, the range of salaries is 2,100 miles.
b.
Make a comment on the shape of the distribution.
Check whether there are any outliers in terms of miles driven.
Answer to Problem 53DA
Thus, the distribution of miles is negatively skewed.
There are no outliers detected in the data.
Explanation of Solution
From the frequency distribution in Part (a), the large number of frequencies occurred in last three classes. Therefore, the distribution of miles is negatively skewed.
There are no observations much higher or much lower than the remaining observations. Thus, no outliers were detected in the data.
c.
Create a cumulative relative frequency polygon for the frequency distribution.
Identify the distance for which less than 40% of the buses are driven.
Find the number of buses that drives less than 10,500 miles.
Answer to Problem 53DA
The cumulative frequency polygon for the given data is as follows:
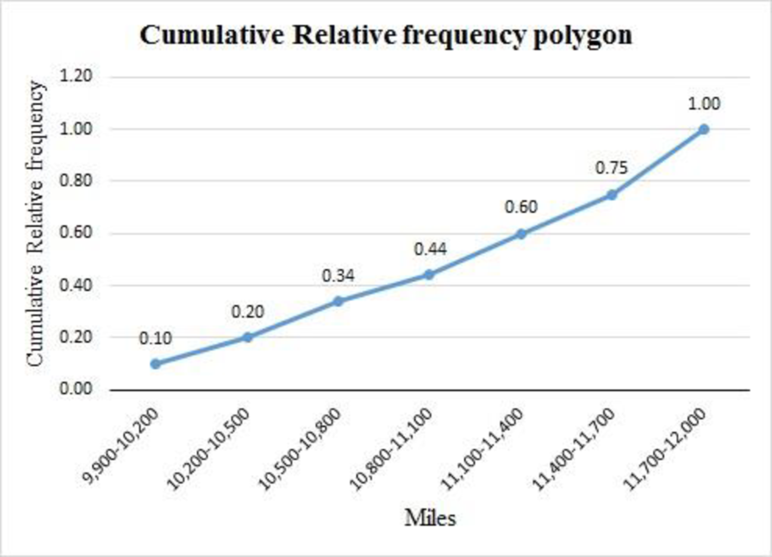
There are 40% of the buses driven less than 1,100 miles.
There are 16 of the buses driven less than 10,500 miles.
Explanation of Solution
For the given data set, the cumulative relative frequency table with midpoints of classes is obtained as follows:
| Miles | Midpoint |
Cumulative frequency |
Relative cumulative frequency |
| 9,900-10,200 | 8 | ||
| 10,200-10,500 | 16 | ||
| 10,500-10,800 | 27 | ||
| 10,800-11,100 | 35 | ||
| 11,100-11,400 | 48 | ||
| 11,400-11,700 | 60 | ||
| 11,700-12,000 | 80 |
The cumulative relative frequency polygon for the given data can be drawn using EXCEL:
Step-by-step procedure to obtain the frequency polygon using EXCEL:
- Enter the column of midpoints along with the cumulative relative frequency column.
- Select the total data range with labels.
- Go to Insert > Charts > line chart.
- Select the appropriate line chart.
- Click OK.
From the above cumulative relative frequency polygon, 40% of the buses are driven less than 1,100 miles.
There are 16 of the buses driven less than 10,500 miles.
d.
Create pie charts for the variables Manufacturer and Capacity.
Answer to Problem 53DA
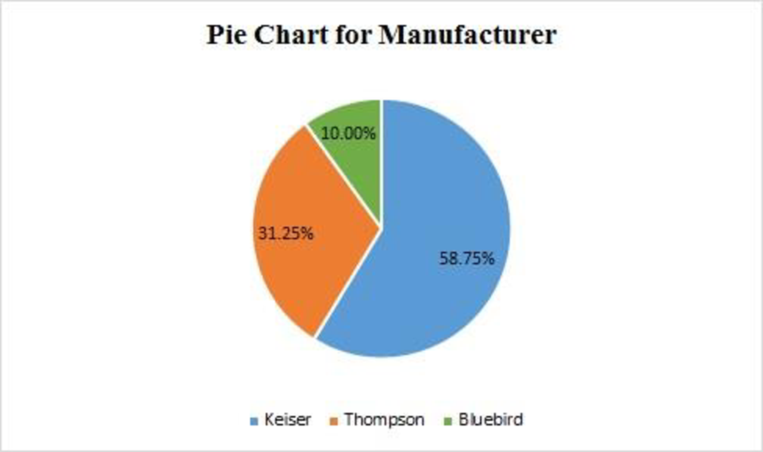
The pie chart for the variable Manufacturer is given as follows:
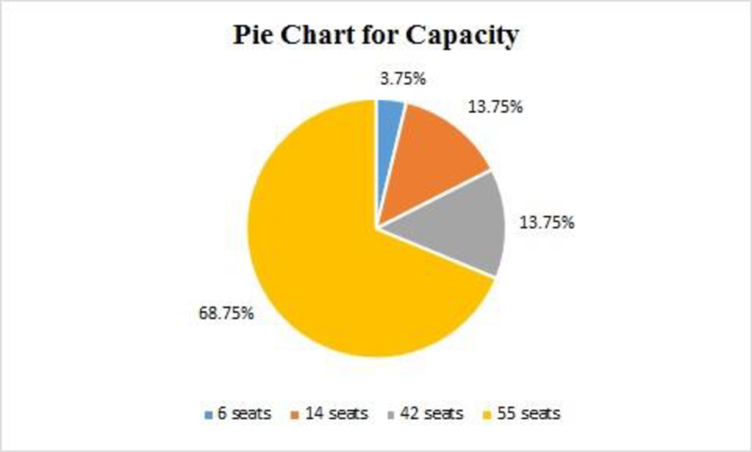
The pie chart for the variable Capacity is given as follows:
Explanation of Solution
Manufacturer:
From the data set, there are three manufacturers in the variable Manufacturer, their corresponding frequencies and percentages of the frequencies are given in the below table:
| Manufacturer | Frequency | % of frequency |
| Bluebird | 47 | |
| Keiser | 25 | |
| Thompson | 8 | |
| Total | 80 |
Step-by-step procedure to obtain the pie chart using EXCEL:
- Enter the Manufacturer column along with the corresponding percentage of frequencies.
- Select the total data range with labels.
- Go to Insert > Charts > Pie chart.
- Select the appropriate Pie chart.
- Click OK.
Capacity:
From the data set, there are four capacities of seats in the variable Capacity, their corresponding frequencies and percentages of the frequencies are given in the below table:
| Capacity | Frequency | % of frequency |
| 6 seats | 3 | |
| 14 seats | 11 | |
| 42 seats | 11 | |
| 55 seats | 55 | |
| Total | 80 |
Step-by-step procedure to obtain the pie chart using EXCEL:
- Enter the Capacity column along with the corresponding percentage of frequencies.
- Select the total data range with labels.
- Go to Insert > Charts > Pie chart.
- Select the appropriate Pie chart.
- Click OK.
Want to see more full solutions like this?
Chapter 2 Solutions
EBK STATISTICAL TECHNIQUES IN BUSINESS


 Glencoe Algebra 1, Student Edition, 9780079039897...AlgebraISBN:9780079039897Author:CarterPublisher:McGraw Hill
 Holt Mcdougal Larson Pre-algebra: Student Edition...AlgebraISBN:9780547587776Author:HOLT MCDOUGALPublisher:HOLT MCDOUGAL
 Big Ideas Math A Bridge To Success Algebra 1: Stu...AlgebraISBN:9781680331141Author:HOUGHTON MIFFLIN HARCOURTPublisher:Houghton Mifflin Harcourt