
STATISTICS F/BUSINESS+ECONOMICS-TEXT
13th Edition
ISBN: 9781305881884
Author: Anderson
Publisher: CENGAGE L
expand_more
expand_more
format_list_bulleted
Concept explainers
Videos
Textbook Question
Chapter 2, Problem 53SE
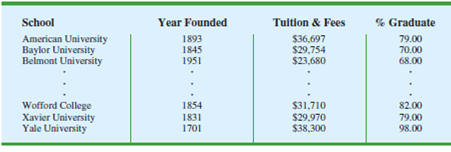
Table 2.18 shows a portion of the data for a sample of 103 private colleges and universities. The complete data set is contained in the file named Colleges. The data include the name of the college or university, the year the institution was founded, the tuition and fees (not including room and board) for the most recent academic year, and the percentage of full time, first-time bachelor’s degree-seeking undergraduate students who obtain their degree in six years or less (The world Almanac, 2012).
- a. Construct a crosstabulation with Year Founded as the row variable and Tuition & Fees as the column variable. Use classes starting with 1600 and ending with 2000 in increments of 50 for Year Founded. For Tuition & Fees, use classes starting with 1 and ending 45000 in increments of 5000.
- b. Compute the row percentages for the crosstabulation in part (a).
- c. What relationship, if any, do you notice between Year Founded and Tuition & Fees?
TABLE 2.18 DATA FOR A SAMPLE OF PRIVATE COLLEGES AND UNIVERSITIES
Expert Solution & Answer

Trending nowThis is a popular solution!

Chapter 2 Solutions
STATISTICS F/BUSINESS+ECONOMICS-TEXT
Ch. 2.1 - Methods 1. The response to a question has three...Ch. 2.1 - A partial relative frequency distribution is...Ch. 2.1 - A questionnaire provides 58 Yes, 42 No, and 20...Ch. 2.1 - for the 20102011 viewing season, the top five...Ch. 2.1 - In alphabetical order, the six most common last...Ch. 2.1 - Nielsen Media Research provided the list of the 25...Ch. 2.1 - The Canmark Research Center Airport Customer...Ch. 2.1 - Data for a sample of 55 members of the Baseball...Ch. 2.1 - Nearly 1.8 million bachelors degrees and over...Ch. 2.1 - VirtualTourist provides ratings for hotels...
Ch. 2.2 - Consider the following data. a. Develop a...Ch. 2.2 - Consider the following frequency distribution....Ch. 2.2 - Construct a histogram for the data in exercise 12.Ch. 2.2 - Consider the following data. a. Construct a dot...Ch. 2.2 - Construct a stem-and-leaf display for the...Ch. 2.2 - Construct a stem-and-leaf display for the...Ch. 2.2 - Applications A doctors office staff studied the...Ch. 2.2 - CBSSports.com developed the Total Player Ratings...Ch. 2.2 - Based on the tons handled in a year, the ports...Ch. 2.2 - The London School of Economics and the Harvard...Ch. 2.2 - Fortune provides a list of Americas largest...Ch. 2.2 - entrepreneur magazine ranks franchises using...Ch. 2.2 - The DATAfile EngineeringSalary contains the median...Ch. 2.2 - Each year America.EDU ranks the best paying...Ch. 2.2 - The 2011 Cincinnati Flying Pig Half-Marathon (13.1...Ch. 2.3 - The following data are for 30 observations...Ch. 2.3 - The following observations are for two...Ch. 2.3 - The Daytona 500 is a 500-mile automobile race held...Ch. 2.3 - The following crosstabulation shows the average...Ch. 2.3 - Recently, management at Oak Tree Golf Course...Ch. 2.3 - The following crosstabulation shows the number of...Ch. 2.3 - Each year Forbes ranks the worlds most valuable...Ch. 2.3 - Refer to Table 2.12. a. Prepare a crosstabulation...Ch. 2.3 - The U.S. Department of Energys Fuel Economy Guide...Ch. 2.4 - The following 20 observations are for two...Ch. 2.4 - Consider the following data on two categorical...Ch. 2.4 - The following crosstabulation summarizes the data...Ch. 2.4 - A study on driving speed (miles per hour) and fuel...Ch. 2.4 - The Current Results website lists the average...Ch. 2.4 - People often wait until middle age to worry about...Ch. 2.4 - Smartphones are advanced mobile phones with...Ch. 2.4 - The Northwest regional manager of an outdoor...Ch. 2 - Approximately 1.5 million high school students...Ch. 2 - The DATAfile MedianHousehold contains the median...Ch. 2 - Data showing the population by state in millions...Ch. 2 - A startup companys ability to gain funding is a...Ch. 2 - Consumer complaints are frequently reported to the...Ch. 2 - The term Beta refers to a measure of a stocks...Ch. 2 - The U.S. Census Bureau serves as the leading...Ch. 2 - western University has only one womens softball...Ch. 2 - Fortune magazine publishes an annual survey of the...Ch. 2 - Table 2.18 shows a portion of the data for a...Ch. 2 - Refer to the data set in Table 2.18. a. Construct...Ch. 2 - Refer to the data set in Table 2.18. a. Construct...Ch. 2 - Refer to the data set in Table 2.18. a. Prepare a...Ch. 2 - Google has changed its strategy with regard to how...Ch. 2 - A zoo has categorized its visitors into three...Ch. 2 - Pelican Stores Pelican Stores, a division of...Ch. 2 - Motion Picture Industry The motion picture...Ch. 2 - Queen City Cincinnati, Ohio, also known as the...
Knowledge Booster


Learn more about
Need a deep-dive on the concept behind this application? Look no further. Learn more about this topic, statistics and related others by exploring similar questions and additional content below.Recommended textbooks for you
 Functions and Change: A Modeling Approach to Coll...AlgebraISBN:9781337111348Author:Bruce Crauder, Benny Evans, Alan NoellPublisher:Cengage Learning
 Linear Algebra: A Modern IntroductionAlgebraISBN:9781285463247Author:David PoolePublisher:Cengage Learning
 Glencoe Algebra 1, Student Edition, 9780079039897...AlgebraISBN:9780079039897Author:CarterPublisher:McGraw Hill
Functions and Change: A Modeling Approach to Coll...
Algebra
ISBN:9781337111348
Author:Bruce Crauder, Benny Evans, Alan Noell
Publisher:Cengage Learning
Linear Algebra: A Modern Introduction
Algebra
ISBN:9781285463247
Author:David Poole
Publisher:Cengage Learning
Glencoe Algebra 1, Student Edition, 9780079039897...
Algebra
ISBN:9780079039897
Author:Carter
Publisher:McGraw Hill
The Shape of Data: Distributions: Crash Course Statistics #7; Author: CrashCourse;https://www.youtube.com/watch?v=bPFNxD3Yg6U;License: Standard YouTube License, CC-BY
Shape, Center, and Spread - Module 20.2 (Part 1); Author: Mrmathblog;https://www.youtube.com/watch?v=COaid7O_Gag;License: Standard YouTube License, CC-BY
Shape, Center and Spread; Author: Emily Murdock;https://www.youtube.com/watch?v=_YyW0DSCzpM;License: Standard Youtube License