Concept explainers
Videos
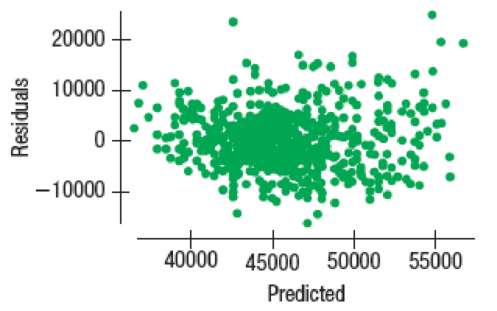
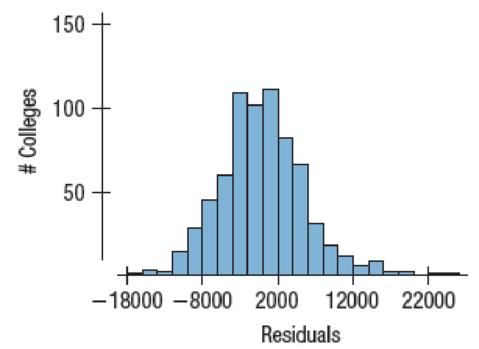
Graduate earnings Does attending college pay back the investment? What factors predict higher earnings for graduates? Money magazine surveyed graduates, asking about their point of view of the colleges they had attended (Money’s Best Colleges at new.time.com/money/best-colleges/rankings/best-colleges/). One good predictor of early career earnings ($/year) turned out to be the average SAT score of entering students. Here are the regression model and associated plots. Write the regression model and explain what the slope coefficient means in this context. Response variable is: Earn
R squared = 30.7%
s = 5603 with 706 – 2 = 704 degrees of freedom
| Variable | Coefficient | SE(Coeff) | t-ratio | P-value |
| Intercept | 14468.1 | 1777 | 8.14 | <0.0001 |
| SAT | 27.2642 | 1.545 | 17.6 | <0.0001 |
Write the regression model.
Explain the slope coefficient means in the context.
Answer to Problem 1E
The regression model is,
The slope coefficient means in the context is the graduates earn approximately $27.26 per year more for each additional point in SAT score.
Explanation of Solution
Given info:
A output shows the regression model and associated plots.
Calculation:
The linear regression model is,
Where,
From the output, it can be observed that the predicted variable is Earn, predictor variable is SAT score, intercept is 14,468.1 and the slope is 27.262.
Thus, the linear regression model that predicts from SAT score is,
Here, the slope coefficient means in the context is the graduates earn approximately $27.26 per year more for each additional point in SAT score.
Want to see more full solutions like this?
Chapter 20 Solutions
MyLab Statistics with Pearson eText -- Standalone Access Card -- for Intro Stats (5th Edition)


- What is regression analysis? Describe the process of performing regression analysis on a graphing utility.arrow_forwardLife Expectancy The following table shows the average life expectancy, in years, of a child born in the given year42 Life expectancy 2005 77.6 2007 78.1 2009 78.5 2011 78.7 2013 78.8 a. Find the equation of the regression line, and explain the meaning of its slope. b. Plot the data points and the regression line. c. Explain in practical terms the meaning of the slope of the regression line. d. Based on the trend of the regression line, what do you predict as the life expectancy of a child born in 2019? e. Based on the trend of the regression line, what do you predict as the life expectancy of a child born in 1580?2300arrow_forwardIf your graphing calculator is capable of computing a least-squares sinusoidal regression model, use it to find a second model for the data. Graph this new equation along with your first model. How do they compare?arrow_forward
 Functions and Change: A Modeling Approach to Coll...AlgebraISBN:9781337111348Author:Bruce Crauder, Benny Evans, Alan NoellPublisher:Cengage Learning
 Glencoe Algebra 1, Student Edition, 9780079039897...AlgebraISBN:9780079039897Author:CarterPublisher:McGraw Hill
 Algebra and Trigonometry (MindTap Course List)AlgebraISBN:9781305071742Author:James Stewart, Lothar Redlin, Saleem WatsonPublisher:Cengage Learning
 Trigonometry (MindTap Course List)TrigonometryISBN:9781305652224Author:Charles P. McKeague, Mark D. TurnerPublisher:Cengage Learning
 Big Ideas Math A Bridge To Success Algebra 1: Stu...AlgebraISBN:9781680331141Author:HOUGHTON MIFFLIN HARCOURTPublisher:Houghton Mifflin Harcourt