Financial & Managerial Accounting
14th Edition
ISBN: 9781337119207
Author: Carl Warren, James M. Reeve, Jonathan Duchac
Publisher: Cengage Learning
expand_more
expand_more
format_list_bulleted
Concept explainers
Videos
Textbook Question
Chapter 20, Problem 20.4APR
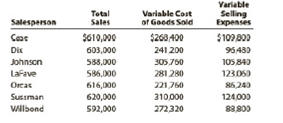
Salespersons' report and analysis
Walthman Industries Inc. employs seven salespersons to sell and distribute- its product throughout the state. Data taken from reports received from the .salespersons during the year ended December 31 are as follows:
Instructions
- 1. Prepare a table indicating contribution margin, variable cost of goods sold as a percent of sales, variable selling expenses as a percent of sales, and contribution margin ratio by salesperson. (Round whole percent to one digit after decimal point.)
- 2. Which salesperson generated the highest contribution margin ratio for the year and why?
- 3. Briefly list factors other than contribution margin that should be considered in evaluating the performance of salespersons.
Expert Solution & Answer

Trending nowThis is a popular solution!

Chapter 20 Solutions
Financial & Managerial Accounting
Ch. 20 - What types of costs are customarily included in...Ch. 20 - Which type of manufacturing cost (direct...Ch. 20 - Which of the following costs would be included in...Ch. 20 - In the variable costing income statement, how are...Ch. 20 - Since all costs of operating a business are...Ch. 20 - Discuss how financial data prepared on the basis...Ch. 20 - Why might management analyze product...Ch. 20 - Explain why rewarding sales personnel on the basis...Ch. 20 - Discuss the two factors affecting both sales and...Ch. 20 - How is the quantity factor for an increase or a...
Ch. 20 - Explain why service companies use different...Ch. 20 - Variable costing Marley Company has the following...Ch. 20 - Variable costingproduction exceeds sales Fixed...Ch. 20 - Variable costing sales exceed production The...Ch. 20 - Analyzing income under absorption and variable...Ch. 20 - Contribution margin by segment The following...Ch. 20 - Contribution margin analysis The actual variable...Ch. 20 - Inventory valuation under absorption costing and...Ch. 20 - Income statements under absorption costing and...Ch. 20 - Income statements under absorption costing and...Ch. 20 - Cost of goods manufactured, using variable costing...Ch. 20 - Variable costing income statement On November 30,...Ch. 20 - Absorption costing income statement On March 31....Ch. 20 - Variable costing income statement The following...Ch. 20 - Estimated income statements, using absorption and...Ch. 20 - Variable and absorption costing Ansara Company had...Ch. 20 - Prob. 20.10EXCh. 20 - Prob. 20.11EXCh. 20 - Product profitability analysis Power Train Sports...Ch. 20 - Territory and product profitability analysis Coast...Ch. 20 - Sales territory and salesperson profitability...Ch. 20 - Segment profitability analysis The marketing...Ch. 20 - Prob. 20.16EXCh. 20 - Contribution margin analysis sales Select Audio...Ch. 20 - Prob. 20.18EXCh. 20 - Contribution margin analysis variable costs Based...Ch. 20 - Variable costing income statement for a service...Ch. 20 - Contribution margin reporting and analysis for a...Ch. 20 - Variable costing income statement and contribution...Ch. 20 - Absorption and variable costing income statements...Ch. 20 - Income statements under absorption costing and...Ch. 20 - Absorption and variable costing income statements...Ch. 20 - Salespersons' report and analysis Walthman...Ch. 20 - Segment variable costing income statement and...Ch. 20 - Contribution margin analysis Farr Industries Inc....Ch. 20 - Prob. 20.1BPRCh. 20 - Income statements under absorption costing and...Ch. 20 - Absorption and variable costing income statements...Ch. 20 - Salespersons' report and analysis Pachec Inc....Ch. 20 - Variable costing income statement and effect on...Ch. 20 - Contribution margin analysis Mathews Company...Ch. 20 - Prob. 1ADMCh. 20 - Prob. 2ADMCh. 20 - Apple Inc.: Segment revenue analysis Segment...Ch. 20 - LVMH: Group segment sales and EBITDA analysis LVMH...Ch. 20 - Prob. 20.1TIFCh. 20 - Communication Bon Jager Inc. manufactures and...
Knowledge Booster


Learn more about
Need a deep-dive on the concept behind this application? Look no further. Learn more about this topic, accounting and related others by exploring similar questions and additional content below.Similar questions
- Salespersons report and analysis Pachec Inc. employs seven salespersons to sell and distribute its product throughout the state. Data taken from reports received from the salespersons during the year ended June 30 are as follows: Instructions 1. Prepare a table indicating contribution margin, variable cost of goods sold as a percent of sales, variable selling expenses as a percent of sales, and contribution margin ratio by salesperson. 2. Which salesperson generated the highest contribution margin ratio for the year and why? 3. Briefly list factors other than contribution margin that should be considered in evaluating the performance of salespersons.arrow_forwardWest Island distributes a single product. The companys sales and expenses for the month of June are shown. Using the information presented, answer these questions: A. What is the break-even point in units sold and dollar sales? B. What is the total contribution margin at the break-even point? C. If West Island wants to earn a profit of $21,000, how many units would they have to sell? D. Prepare a contribution margin income statement that reflects sales necessary to achieve the target profit.arrow_forwardUsing the information in the previous exercises about Marleys Manufacturing, determine the operating income for department B, assuming department A sold department B 1,000 units during the month and department A reduces the selling price to the market price.arrow_forward
- Cost of Goods Manufactured, Income Statement W. W. Phillips Company produced 4,000 leather recliners during the year. These recliners sell for 400 each. Phillips had 500 recliners in finished goods inventory at the beginning of the year. At the end of the year, there were 700 recliners in finished goods inventory. Phillips accounting records provide the following information: Required: 1. Prepare a statement of cost of goods manufactured. 2. Compute the average cost of producing one unit of product in the year. 3. Prepare an income statement for external users.arrow_forwardUse the following information for Exercises 2-47 through 2-49. Jasper Company provided the following information for last year: Last year, beginning and ending inventories of work in process and finished goods equaled zero. Exercise 2-49 Income Statement Refer to the information for Jasper Company on the previous page. Required: 1. Prepare an income statement for Jasper for last year. Calculate the percentage of sales for each line item on the income statement. (Note: Round percentages to the nearest tenth of a percent.) 2. CONCEPTUAL CONNECTION Briefly explain how a manager could use the income statement created for Requirement 1 to better control costs.arrow_forwardIncome Statements under Absorption and Variable Costing In the coming year, Kalling Company expects to sell 28,700 units at 32 each. Kallings controller provided the following information for the coming year: Required: 1. Calculate the cost of one unit of product under absorption costing. 2. Calculate the cost of one unit of product under variable costing. 3. Calculate operating income under absorption costing for next year. 4. Calculate operating income under variable costing for next year.arrow_forward
- Quality Cost Report Whitley Company had total sales of 1,000,000 for the year ending 20X1. The costs of quality are given below. Required: 1. Prepare a quality cost report, classifying costs by category and expressing each category as a percentage of sales. What message does the cost report provide? 2. Prepare a bar graph and pie chart that illustrate each categorys contribution to total quality costs. Comment on the significance of the distribution.arrow_forwardQuality Cost Report Loring Company had total sales of 2,400,000 for fiscal 20X1. The costs of quality-related activities are given below. Required: 1. Prepare a quality cost report, classifying costs by category and expressing each category as a percentage of sales. What message does the cost report provide? 2. Prepare a bar graph and pie chart that illustrate each categorys contribution to total quality costs. Comment on the significance of the distribution.arrow_forwardContribution margin, break-even sales, cost-volume-profit chart, margin of safety, and operating leverage Belmain Co. expects to maintain the same inventories at the end of 20Y7 as at the beginning of the year. The total of all production costs for the year is therefore assumed to be equal to the cost of goods sold. With this in mind, the various department heads were asked to submit estimates of the costs for their departments during the year. A summary report of these estimates is as follows: It is expected that 12,000 units will be sold at a price of 240 a unit. Maximum sales within the relevant range are 18,000 units. Instructions 1. Prepare an estimated income statement for 20Y7. 2. What is the expected contribution margin ratio? 3. Determine the break-even sales in units and dollars. 4. Construct a cost-volume-profit chart indicating the break-even sales. 5. What is the expected margin of safety in dollars and as a percentage of sales? (Round to one decimal place.) 6. Determine the operating leverage.arrow_forward
- Bradshaw Company reported sales of 5,000,000 in 20X1. At the end of the fiscal year (June 30, 20X1), the following quality costs were reported: Required: 1. Prepare a quality cost report. 2. Prepare a graph (pie chart or bar graph) that shows the relative distribution of quality costs, and comment on the distribution. 3. Assuming sales of 5,000,000, by how much would profits increase if quality improves so that quality costs are only 3% of sales?arrow_forwardCustomers as a Cost Object Morrisom National Bank has requested an analysis of checking account profitability by customer type. Customers are categorized according to the size of their account: low balances, medium balances, and high balances. The activities associated with the three different customer categories and their associated annual costs are as follows: Additional data concerning the usage of the activities by the various customers are also provided: Required: (Note: Round answers to two decimal places.) 1. Calculate a cost per account per year by dividing the total cost of processing and maintaining checking accounts by the total number of accounts. What is the average fee per month that the bank should charge to cover the costs incurred because of checking accounts? 2. Calculate a cost per account by customer category by using activity rates. 3. Currently, the bank offers free checking to all of its customers. The interest revenues average 90 per account; however, the interest revenues earned per account by category are 80, 100, and 165 for the low-, medium-, and high-balance accounts, respectively. Calculate the average profit per account (average revenue minus average cost from Requirement 1). Then calculate the profit per account by using the revenue per customer type and the unit cost per customer type calculated in Requirement 2. 4. CONCEPTUAL CONNECTION After the analysis in Requirement 3, a vice president recommended eliminating the free checking feature for low-balance customers. The bank president expressed reluctance to do so, arguing that the low-balance customers more than made up for the loss through cross-sales. He presented a survey that showed that 50% of the customers would switch banks if a checking fee were imposed. Explain how you could verify the presidents argument by using ABC.arrow_forwardEllerson Company provided the following information for the last calendar year: During the year, direct materials purchases amounted to 278,000, direct labor cost was 189,000, and overhead cost was 523,000. During the year, 100,000 units were completed. Refer to Exercise 2.21. Last calendar year, Ellerson recognized revenue of 1,312,000 and had selling and administrative expenses of 204,600. Required: 1. What is the cost of goods sold for last year? 2. Prepare an income statement for Ellerson for last year.arrow_forward
arrow_back_ios
SEE MORE QUESTIONS
arrow_forward_ios
Recommended textbooks for you
 Financial And Managerial AccountingAccountingISBN:9781337902663Author:WARREN, Carl S.Publisher:Cengage Learning,
 Managerial AccountingAccountingISBN:9781337912020Author:Carl Warren, Ph.d. Cma William B. TaylerPublisher:South-Western College Pub
 Principles of Accounting Volume 2AccountingISBN:9781947172609Author:OpenStaxPublisher:OpenStax College
 Managerial Accounting: The Cornerstone of Busines...AccountingISBN:9781337115773Author:Maryanne M. Mowen, Don R. Hansen, Dan L. HeitgerPublisher:Cengage Learning
 Cornerstones of Cost Management (Cornerstones Ser...AccountingISBN:9781305970663Author:Don R. Hansen, Maryanne M. MowenPublisher:Cengage Learning
 Survey of Accounting (Accounting I)AccountingISBN:9781305961883Author:Carl WarrenPublisher:Cengage Learning
Financial And Managerial Accounting
Accounting
ISBN:9781337902663
Author:WARREN, Carl S.
Publisher:Cengage Learning,
Managerial Accounting
Accounting
ISBN:9781337912020
Author:Carl Warren, Ph.d. Cma William B. Tayler
Publisher:South-Western College Pub
Principles of Accounting Volume 2
Accounting
ISBN:9781947172609
Author:OpenStax
Publisher:OpenStax College
Managerial Accounting: The Cornerstone of Busines...
Accounting
ISBN:9781337115773
Author:Maryanne M. Mowen, Don R. Hansen, Dan L. Heitger
Publisher:Cengage Learning
Cornerstones of Cost Management (Cornerstones Ser...
Accounting
ISBN:9781305970663
Author:Don R. Hansen, Maryanne M. Mowen
Publisher:Cengage Learning
Survey of Accounting (Accounting I)
Accounting
ISBN:9781305961883
Author:Carl Warren
Publisher:Cengage Learning
Cost-Volume-Profit (CVP) Analysis and Break-Even Analysis Step-by-Step, by Mike Werner; Author: Accounting Step by Step;https://www.youtube.com/watch?v=D0MOfse9OWk;License: Standard Youtube License